
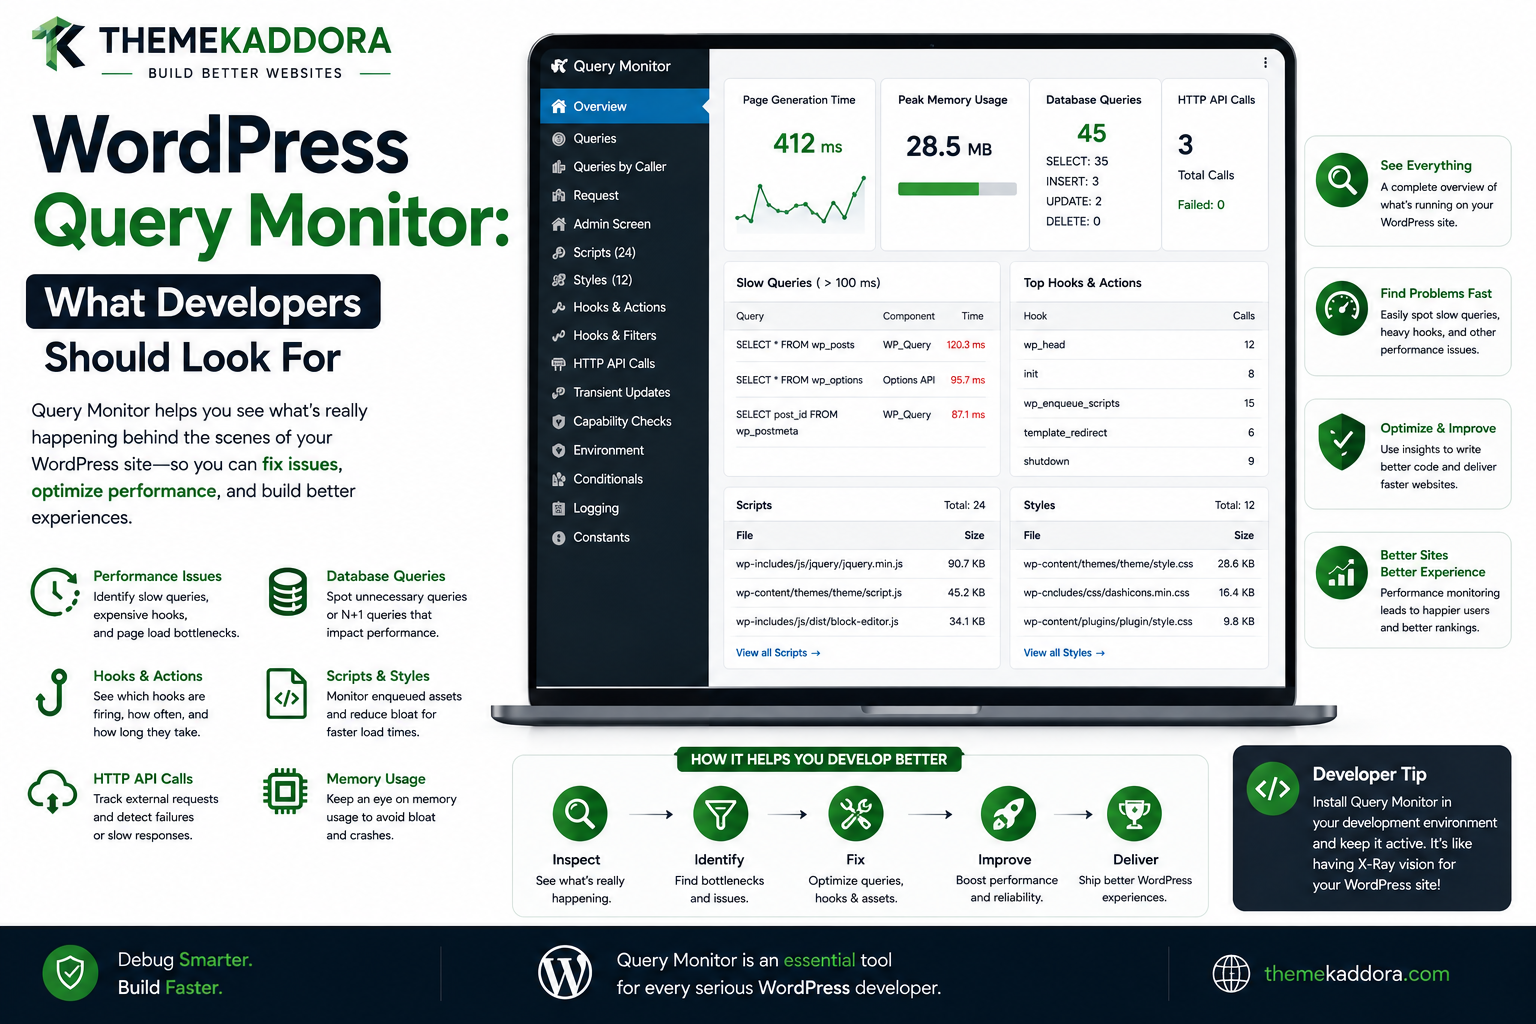
WordPress Query Monitor: What Developers Should Look For
Introduction
WordPress performance problems are often difficult to diagnose by looking only at the final page.
A page may appear slow, but the reason could be:
A slow database query
Hundreds of database queries
Duplicate queries
An inefficient plugin
An external HTTP request
A PHP warning
A large template operation
Excessive hooks
Slow REST calls
A poorly optimized Custom Post Type query
Heavy WooCommerce processing
Expensive metadata lookups
An inefficient custom database table
Simply saying:
"The website is slow."
does not identify the actual bottleneck.
Developers need evidence.
This is where Query Monitor becomes extremely useful during WordPress development and troubleshooting.
Query Monitor is a developer-focused debugging and profiling tool that can expose information about what WordPress is doing during a request.
A simplified debugging model is:
Slow Request ↓ Query Monitor ↓ ┌──────────────┬──────────────┬──────────────┐ ▼ ▼ ▼ Database PHP HTTP Queries Errors Requests │ │ │ └──────────────┼──────────────┘ ▼ Root Cause
The important point is:
Query Monitor is not an optimization itself. It is a diagnostic tool that helps developers identify what should be optimized.
For example, Query Monitor may reveal:
237 Database Queries
That number alone does not prove the page is broken.
A better question is:
Which queries are slow? Which are duplicated? Which plugin generated them? Which query runs repeatedly?
Another page might have:
35 Queries
but one query may take most of the request time.
Therefore, the number of queries is only one part of the analysis.
Query Monitor becomes particularly useful when developing:
Themes
WooCommerce extensions
AI plugins
Analytics systems
Custom database applications
REST APIs
AJAX features
In this guide, you'll learn what to look for in Query Monitor, how to interpret database query information, how to identify slow queries, how to recognize N+1 patterns, how to trace queries back to plugins and themes, how to inspect PHP errors, how to analyze HTTP requests, how to inspect hooks and template information, how to debug admin and frontend requests separately, how to use Query Monitor safely, and how ThemeKaddora developers can incorporate request profiling into a professional optimization workflow.
What Is Query Monitor?
Query Monitor is a developer-oriented debugging and profiling plugin for WordPress.
It exposes information about the current request and the operations WordPress performed while processing it.
Depending on the request, useful information can include:
Database queries
Query timing
Duplicate queries
PHP errors
HTTP requests
Hooks
Template information
Enqueued scripts
Enqueued styles
Conditional context
Request information
The objective is visibility.
Query Monitor Is a Diagnostic Tool
It is useful to think of Query Monitor like a diagnostic dashboard.
It helps answer:
What happened during this request?
It does not automatically answer:
What is the perfect optimization?
Developers still need to interpret the evidence.
Why Query Monitoring Matters
Without profiling, developers often guess.
For example:
Website Slow ↓ Maybe Hosting? ↓ Maybe Theme? ↓ Maybe Images? ↓ Maybe WordPress?
With query monitoring:
Website Slow ↓ Profile Request ↓ Slow Query Found ↓ Plugin Identified ↓ Fix ↓ Measure Again
Evidence makes optimization much more reliable.
Start With the Total Request
Before examining individual queries, understand the overall request.
Look at:
Page generation time
Database query count
Database query time
Memory usage
HTTP requests
Errors
Template
This gives you a high-level performance profile.
Database Query Count
One of the most visible metrics is query count.
For example:
Total Queries: 48
or:
Total Queries: 428
A high count deserves investigation, but the count alone is not enough.
Query Count Is Not the Same as Query Cost
Suppose:
Page A → 100 Very Fast Queries
and:
Page B → 20 Slow Queries
Page B could easily be slower.
The key metrics are:
How many? + How long? + Why?
Look at Total Database Time
A useful question is:
How much of the request is being spent communicating with the database?
If total database time is unusually large compared with total request time, investigate database operations before changing frontend assets.
Find the Slowest Queries
A good first step is to sort or inspect queries by execution time.
Look for queries such as:
0.001 s 0.002 s 0.003 s 1.250 s
The 1.250-second query is much more important than the first three.
One Slow Query Can Dominate the Page
A page might show:
85 Queries Total Time: 1.9 seconds
If one query consumes:
1.2 seconds
it becomes the obvious starting point.
Query Timing vs Total Page Time
Remember that total request time includes more than database operations.
The request may also spend time on:
PHP execution
External HTTP calls
Rendering
Object processing
Hooks
Cache operations
Therefore, fixing one query may not solve the entire performance problem.
Look for Duplicate Queries
Duplicate queries can be a sign of inefficient application logic.
For example:
SELECT ... SELECT ... SELECT ... SELECT ...
where the same query appears repeatedly.
This can happen when:
A function runs inside a Loop
A template part repeats database work
A plugin does not reuse prepared data
A feature lacks caching
Why Duplicate Queries Matter
Consider:
Same Query × 100
Even if one query is fast, 100 unnecessary executions can create significant total overhead.
N+1 Query Patterns
One of the most important things to look for is an N+1 query pattern.
Conceptually:
1 Query → Retrieves 50 Products 50 Additional Queries → One Per Product
Total:
51 Queries
This can often be optimized through batching, caching, or data preloading.
Example N+1 Pattern
Imagine an archive displays 30 products.
The main query retrieves:
30 Products
Then each product triggers another query for:
Recommendation
The pattern becomes:
1 Product Query + 30 Recommendation Queries
Query Monitor can help expose the repeated pattern.
Identify the Query Caller
A very useful debugging question is:
Which plugin or theme generated this query?
Query Monitor can provide information that helps attribute database activity to code components.
This allows the investigation to move from:
Slow SQL
to:
Slow SQL ↓ Plugin ↓ Specific Code Path
Plugin vs Theme Attribution
A query may originate from:
Plugin Theme WordPress Core
This distinction changes how you should troubleshoot it.
If a theme's template performs an expensive query, a theme optimization may be needed.
If a plugin produces hundreds of queries globally, the plugin architecture should be reviewed.
Do Not Automatically Blame WordPress Core
Core queries are often necessary.
The goal is not:
Remove all WordPress core queries.
Instead ask:
Which query is unexpected, expensive, or repeated?
Query Source and Call Stack
When debugging a problematic query, trace it back through the relevant code path.
A useful progression is:
SQL Query ↓ Calling Function ↓ Plugin / Theme ↓ Feature
This is much more actionable than staring at SQL alone.
Inspect Queries During Different Contexts
A plugin can behave differently during:
Frontend
Admin
REST
AJAX
Cron
Always profile the context where the problem occurs.
Frontend Query Monitoring
For a slow product page, inspect:
Main Query Metadata Taxonomies WooCommerce Recommendations External Data
Do not assume the same query pattern exists on the dashboard.
Admin Query Monitoring
For a slow admin report:
Report Query Aggregations Custom Tables User Filters External APIs
Admin requests can have very different workloads from frontend requests.
REST Query Monitoring
REST endpoints can be surprisingly expensive.
For example:
GET /wp-json/kdr/v1/products
may trigger:
Product queries
Metadata
Taxonomies
Permissions
External API calls
Profile the API request separately from the normal page.
AJAX Query Monitoring
AJAX filters can generate repeated queries.
For example:
User Click ↓ AJAX Query ↓ User Click ↓ AJAX Query ↓ User Click ↓ AJAX Query
Query Monitor can help determine whether each request is doing more work than necessary.
Cron Query Monitoring
Background jobs can produce high query volume without directly affecting the visitor's page request.
However, excessive Cron database activity can still impact server resources.
Profile heavy scheduled tasks separately.
Look for Expensive Meta Queries
WordPress metadata queries can become expensive on large datasets.
A feature might filter by:
_price _rating _custom_status
A complex metadata query can become a bottleneck.
Meta Query Optimization
If a query is consistently slow:
Inspect the query structure
Review data volume
Check indexes where appropriate
Consider a different data model
Reduce unnecessary filters
Cache repeated results
Do not add indexes blindly.
Look for Expensive Taxonomy Queries
Taxonomy-heavy queries can also become costly in large content environments.
For example:
Many Posts + Several Taxonomy Conditions + Sorting
can require substantial database work.
Look for Complex Ordering
Queries that order results by:
Metadata
Randomness
Calculated values
Complex relationships
can be expensive.
Query Monitor helps identify the actual query so developers can evaluate whether the ordering strategy is necessary.
Random Sorting
A common performance concern is random ordering.
For example:
ORDER BY RAND()
can be particularly expensive on large datasets.
If the product requires randomized recommendations, consider a more scalable approach.
Look for Unbounded Queries
Queries that retrieve very large numbers of records can create:
Memory usage
Processing overhead
Long execution time
A page displaying:
20 Records
should not normally retrieve:
20,000 Records
just to render the first page.
Check Query Pagination
If an interface has pagination, verify that the backend query also uses sensible limits.
A UI with pagination does not automatically mean the database query is efficient.
Inspect $wpdb Queries
Custom plugins may use:
$wpdb
for specialized database access.
Query Monitor can help identify:
SQL statements
Timing
Query counts
Repeated queries
This is especially useful for custom analytics or SaaS tables.
Prepared Queries and Performance
Prepared SQL protects against injection but does not automatically make a query efficient.
A safe query can still be:
Very Slow
Security and performance are separate concerns.
Look for Large Table Scans
A query can become expensive when the database scans a large dataset.
For custom database systems, investigate:
Indexes
Query structure
Filters
Sort conditions
Data volume
Query Monitor can help identify the query to investigate further with database-level profiling tools.
Query Monitor Is Not a Database Execution Plan Tool
This distinction matters.
Query Monitor tells you about the query executed by WordPress.
For deeper database analysis, developers may also need database-native tools such as execution plans and index analysis.
The workflow can be:
Query Monitor ↓ Find Slow SQL ↓ Database Profiling ↓ Execution Plan ↓ Optimization
PHP Errors
Query Monitor can also surface PHP-related problems.
Look for:
Warnings
Notices
Deprecated behavior
Fatal errors
Incorrect usage warnings
A page can be slow or unstable because PHP is repeatedly producing errors.
Why PHP Warnings Matter
A warning may not crash the page, but repeated warnings can:
Increase processing
Fill logs
Hide real problems
Indicate broken code
A healthy production plugin should not generate unnecessary warnings.
Deprecated Functions
Modern WordPress environments may report deprecated APIs.
These warnings are important because they can indicate future compatibility problems.
A plugin should not ignore persistent deprecation messages.
PHP Fatal Errors
Fatal errors are more serious.
They can stop the request completely.
Query Monitor and WordPress debugging tools can help identify:
File Line Component Error
Use this information to identify the responsible code.
PHP Errors vs Server Errors
Not every failure is a WordPress PHP problem.
A request can also fail due to:
Web server
PHP-FPM
Database server
CDN
Network
External API
Use Query Monitor as one layer of the diagnostic process.
HTTP API Requests
Query Monitor can help expose outgoing HTTP requests made during the current WordPress request.
For example:
WordPress ↓ CRM API ↓ 300 ms
or:
AI API ↓ 2.5 seconds
This can explain why a page is slow even when the database is fast.
External API Calls Inside Loops
A serious pattern to investigate is:
20 Products ↓ 20 API Calls
Query Monitor can reveal that the request is spending substantial time waiting on HTTP operations.
The solution may involve:
Caching
Batching
Background jobs
Precomputed data
HTTP Timeout Problems
A remote request can be delayed by:
Slow provider
Network issues
DNS
Timeout settings
Rate limiting
A plugin should use appropriate timeout values.
REST API Calls to the Same Site
A WordPress plugin can accidentally make HTTP requests back to its own site.
For example:
WordPress Page ↓ wp_remote_get() ↓ Same WordPress Site ↓ Another WordPress Request
This can create unnecessary recursive application work.
Profile these carefully.
Hooks and Actions
Query Monitor can also provide visibility into hooks and callbacks involved in the current request.
This is useful when:
Something runs
but you don't know:
Which hook triggered it?
Why Hook Timing Matters
A feature might execute through:
init wp template_redirect wp_enqueue_scripts wp_footer
or an admin-specific hook.
Understanding timing helps explain why a condition does or does not work.
Hook Priority
Two callbacks can run on the same hook at different priorities.
For example:
Hook ├── Priority 10 ├── Priority 20 └── Priority 50
The order can influence behavior.
When debugging conflicts, inspect which callbacks are attached and when they run.
Template Information
Query Monitor can help identify the template associated with a frontend request.
This is particularly useful when:
Expected Template
does not appear to be executing.
The investigation can then examine:
Template hierarchy
Child theme
Parent theme
Plugin overrides
Conditional Context Information
For frontend requests, query-monitoring information can help developers understand the current context:
Single Archive Search 404
This is useful when a plugin's conditional logic behaves unexpectedly.
Scripts and Styles
Query Monitor can help developers inspect loaded assets.
Look for:
Unnecessary scripts
Unnecessary styles
Duplicate dependencies
Unexpected assets
Large plugin bundles
This is useful for frontend and admin optimization.
Example: Plugin Loading Assets Globally
Suppose a plugin loads:
admin.js charts.js reports.css
on every page.
Query Monitor can make the unnecessary asset loading visible.
The plugin should instead scope assets to the required admin screens or frontend contexts.
Query Monitor and Duplicate Assets
If multiple components enqueue similar libraries or scripts, inspect:
Handles Dependencies Source Files
Then determine whether duplicate dependencies can be removed.
Memory Usage
Memory consumption is another useful signal.
A request can be slow because it is processing a large amount of data in PHP even when database query times are reasonable.
Examples include:
Huge arrays
Large API responses
Large HTML generation
Bulk imports
Image processing
High Memory Usage in Loops
A plugin may retrieve:
10,000 Records
and then load all of them into PHP memory.
A better architecture may use:
Pagination
Batching
Streaming
Background jobs
Query Monitor and WordPress Loop Performance
For a slow Loop, inspect:
Main Query + Repeated Queries + HTTP Requests + Template Parts
This helps identify whether the Loop is actually the problem or whether the issue comes from the data retrieval layer.
Query Monitor and WooCommerce
WooCommerce stores and retrieves large amounts of data.
When a WooCommerce page is slow, inspect:
Product queries
Metadata
Orders
Customer data
Taxonomies
Extensions
External services
Do not assume WooCommerce core is automatically responsible for every slow query.
Find the expensive operation first.
Query Monitor and AI Plugins
AI features can introduce significant HTTP latency.
If a page takes:
3 seconds
and Query Monitor shows a remote request taking:
2.5 seconds
the optimization should focus on the AI workflow rather than trying to remove harmless database queries.
Query Monitor and Analytics
Analytics plugins may use:
Custom tables
Aggregation queries
REST APIs
Scheduled jobs
A report that takes several seconds may need:
Pre-Aggregation + Caching + Indexes
rather than more frontend optimization.
Query Monitor and SaaS Plugins
A SaaS dashboard may combine:
Tenant Query + User Permissions + Billing Data + External APIs
Profiling helps determine which layer is actually slow.
Query Monitor and Admin Screens
When a plugin's admin screen is slow:
Profile Admin Request ↓ Queries ↓ HTTP ↓ PHP ↓ Assets
Do not assume the frontend optimization strategy applies to the admin.
Query Monitor and REST APIs
Profile API endpoints individually.
For example:
GET /wp-json/kdr/v1/reports
should be measured as an API request.
Look for:
Query count
Query time
HTTP requests
PHP errors
Response size
Query Monitor and AJAX
Each AJAX request should be profiled separately.
A page may be fast while its filter endpoint is slow.
The architecture might be:
Fast Page + Slow AJAX = Poor User Experience
Query Monitor and Cron
Cron jobs should be profiled when they perform heavy work.
Look for:
Database time
Number of records processed
External requests
Memory usage
Locking
Repeated execution
Common Performance Patterns Query Monitor Can Reveal
N+1 Queries
1 + N
Duplicate Queries
Same SQL Repeated
Slow External API
HTTP → 2 seconds
Global Plugin Work
Plugin Code → Every Request
Large Admin Report
Admin Screen → Expensive Aggregation
What Developers Should Not Do With Query Monitor
Do not optimize based only on:
Largest Query Count
or:
Any Query That Looks Complicated
Instead, combine:
Query time
Frequency
Source
Data volume
Request context
User experience
Query Profiling Workflow
A strong workflow is:
1. Reproduce Problem 2. Profile Request 3. Identify Bottleneck 4. Find Source 5. Understand Why 6. Change Code 7. Profile Again 8. Compare Results
Never assume an optimization worked until it is measured again.
Before and After Comparison
Suppose:
Before Queries: 210 DB Time: 1.8s
After optimization:
After Queries: 70 DB Time: 0.4s
This is useful evidence that the change improved the database portion of the request.
Do Not Optimize Without a Baseline
A baseline tells you:
Current Performance
Without one, developers may make changes without knowing whether performance improved or worsened.
Query Monitor and Staging
Use profiling primarily in development or staging environments.
Avoid leaving heavy debugging tools active on a busy production website longer than necessary.
Production Debugging
When production diagnosis is necessary:
Protect access
Avoid exposing sensitive information
Minimize overhead
Use appropriate logging
Remove debugging tools after diagnosis
Debug information can contain sensitive implementation details.
Query Monitor and Security
Debugging data may reveal:
Database structure
File paths
Query content
Plugin names
User information
API requests
Only authorized developers should have access.
Query Monitor and Privacy
When profiling systems involving customer data, analytics, or WooCommerce, ensure debugging output does not expose sensitive personal or transactional information to unauthorized users.
Professional Query Monitoring Architecture
A developer-oriented troubleshooting model can be:
Request │ ▼ Profile Request │ ┌──────────────┼──────────────┐ ▼ ▼ ▼ Database PHP HTTP │ │ │ └──────────────┼──────────────┘ ▼ Hooks │ ▼ Template │ ▼ Assets │ ▼ Root Cause
This prevents database-only tunnel vision.
Query Monitor Checklist
For every slow request, inspect:
☑ Total request time ☑ Total query count ☑ Total database time ☑ Slowest queries ☑ Duplicate queries ☑ Query caller ☑ PHP warnings/errors ☑ HTTP requests ☑ Template ☑ Hooks ☑ Loaded scripts ☑ Loaded styles ☑ Memory usage ☑ Request context
Common Query Monitor Mistakes
Focusing Only on Query Count
A low count can still hide one extremely slow query.
Blaming Core Queries Automatically
Core queries can be necessary.
Ignoring HTTP Requests
External services can dominate request time.
Ignoring Duplicate Queries
Repeated small queries can accumulate significantly.
Profiling Only the Homepage
Other pages may have very different workloads.
Ignoring Admin Requests
Admin screens can have their own performance problems.
Ignoring REST and AJAX
Application APIs may be the actual bottleneck.
Making Changes Without Reprofiling
You need before-and-after measurements.
Best Practices for Query Monitor
A professional WordPress development workflow should:
Establish a performance baseline.
Profile the exact request with the problem.
Inspect both query count and query time.
Identify duplicate and N+1 queries.
Trace slow queries to their source.
Inspect outgoing HTTP requests.
Review PHP warnings and errors.
Check template and hook context.
Review loaded scripts and styles.
Test frontend and admin separately.
Profile REST, AJAX, and Cron where relevant.
Re-run profiling after optimization.
Perform debugging in protected development or staging environments.
Why choose ThemeKaddora?
ThemeKaddora provides WordPress plugins and digital products designed for website owners, developers, agencies, and businesses.
Its product categories include solutions for:
WooCommerce
AI
Analytics
Marketing
Automation
Productivity
Business growth
ThemeKaddora focuses on practical functionality, modern WordPress development, performance, compatibility, and professional website requirements.
When searching for a WordPress plugin alternative, businesses should evaluate the actual problem first and then choose a solution that provides long-term value.
Conclusion
Query Monitor is valuable because it turns a vague performance complaint into observable evidence.
Instead of:
"This WordPress page feels slow."
you can investigate:
Query Count Query Time Duplicate Queries HTTP Requests PHP Errors Hooks Template Assets Memory
The most important lesson is that no single metric tells the complete story.
A page with 200 queries is not automatically worse than a page with 30 queries.
A page with 30 queries can still be slow if one query takes most of the request time.
Similarly, a page with excellent database performance can still be slow because an external API takes several seconds.
The correct optimization process is therefore:
Measure
→ Identify
→ Understand
→ Optimize
→ Measure Again
For WordPress plugins, Query Monitor is especially valuable for detecting N+1 query patterns.
Instead of:
1 Query + 50 Additional Queries
developers may be able to use:
1 Efficient Query + Prepared Data + Cache
The same principle applies to HTTP requests.
Instead of:
20 Products ↓ 20 API Requests
a better architecture may use:
Batch Request ↓ Cached Results ↓ Loop
Query Monitor also helps diagnose non-database issues.
For example:
Database → Fast External API → Slow
In this scenario, database optimization is not the first priority.
Likewise:
Queries → Reasonable PHP Errors → Hundreds
suggests that application code needs attention.
For ThemeKaddora products, profiling should be part of the normal development workflow.
Whether the product is:
AI
WooCommerce
Analytics
SaaS
Automation
Search
Reporting
developers should profile real requests instead of optimizing based on assumptions.
The most important principle is:
Use Query Monitor to discover where WordPress is spending time, trace the expensive operation back to its source, fix the underlying cause, and verify the improvement with another measurement.
Query monitoring should lead to better architecture, not merely lower query counts.
A professional optimization workflow is:
Baseline
→ Profile
→ Find Bottleneck
→ Fix Root Cause
→ Regression Test
→ Measure Again
That approach produces WordPress applications that are not only faster but also easier to maintain, debug, and scale.
Frequently Asked Questions
What is WordPress Query Monitor?
Query Monitor is a developer-oriented WordPress debugging and profiling tool that provides visibility into database queries, PHP errors, HTTP requests, hooks, templates, assets, and other request information.
Does Query Monitor automatically optimize WordPress?
No. It is primarily a diagnostic tool. Developers use the information it provides to identify what should be optimized.
Is a high database query count always bad?
No. Query count should be considered alongside query timing, duplication, complexity, request context, and total database time.
What is an N+1 query problem?
It occurs when one query retrieves a collection and then additional queries are executed individually for each item in that collection.
How can Query Monitor help find N+1 queries?
It can show repeated database queries and help identify the source generating them, allowing developers to investigate whether batching, caching, or preloading can reduce the repetition.
What should I look at first in Query Monitor?
Start with total request time, database query count, total database time, slowest queries, duplicate queries, outgoing HTTP requests, PHP errors, and the component responsible for the work.
Can Query Monitor identify slow external APIs?
It can provide visibility into outgoing HTTP requests, allowing developers to see whether external services are contributing significant latency.
Can Query Monitor debug admin pages?
Yes. Admin requests can be profiled separately from frontend requests.
Can Query Monitor help debug REST APIs?
Yes. Developers can profile REST requests independently and inspect their queries, errors, HTTP requests, and other request information.
Can Query Monitor help debug AJAX requests?
Yes. Each AJAX request can be investigated independently to identify expensive database operations, PHP errors, or external requests.
Should Query Monitor be used on a busy production website?
It is primarily a development and debugging tool. If production diagnosis is necessary, access should be carefully controlled and the additional overhead and information exposure should be considered.
Can Query Monitor identify the plugin responsible for a query?
It can provide information that helps trace database queries back to their originating component or code path, making it easier to identify the responsible plugin or theme.
Why choose Themekaddora?
Themekaddora provides lightweight, responsive, SEO-friendly WordPress themes with fast performance, WooCommerce compatibility, flexible customization, accessibility-conscious design, modern templates, regular updates, and professional support—providing a strong foundation for businesses building digital products and product-focused websites.
Comments (0)