
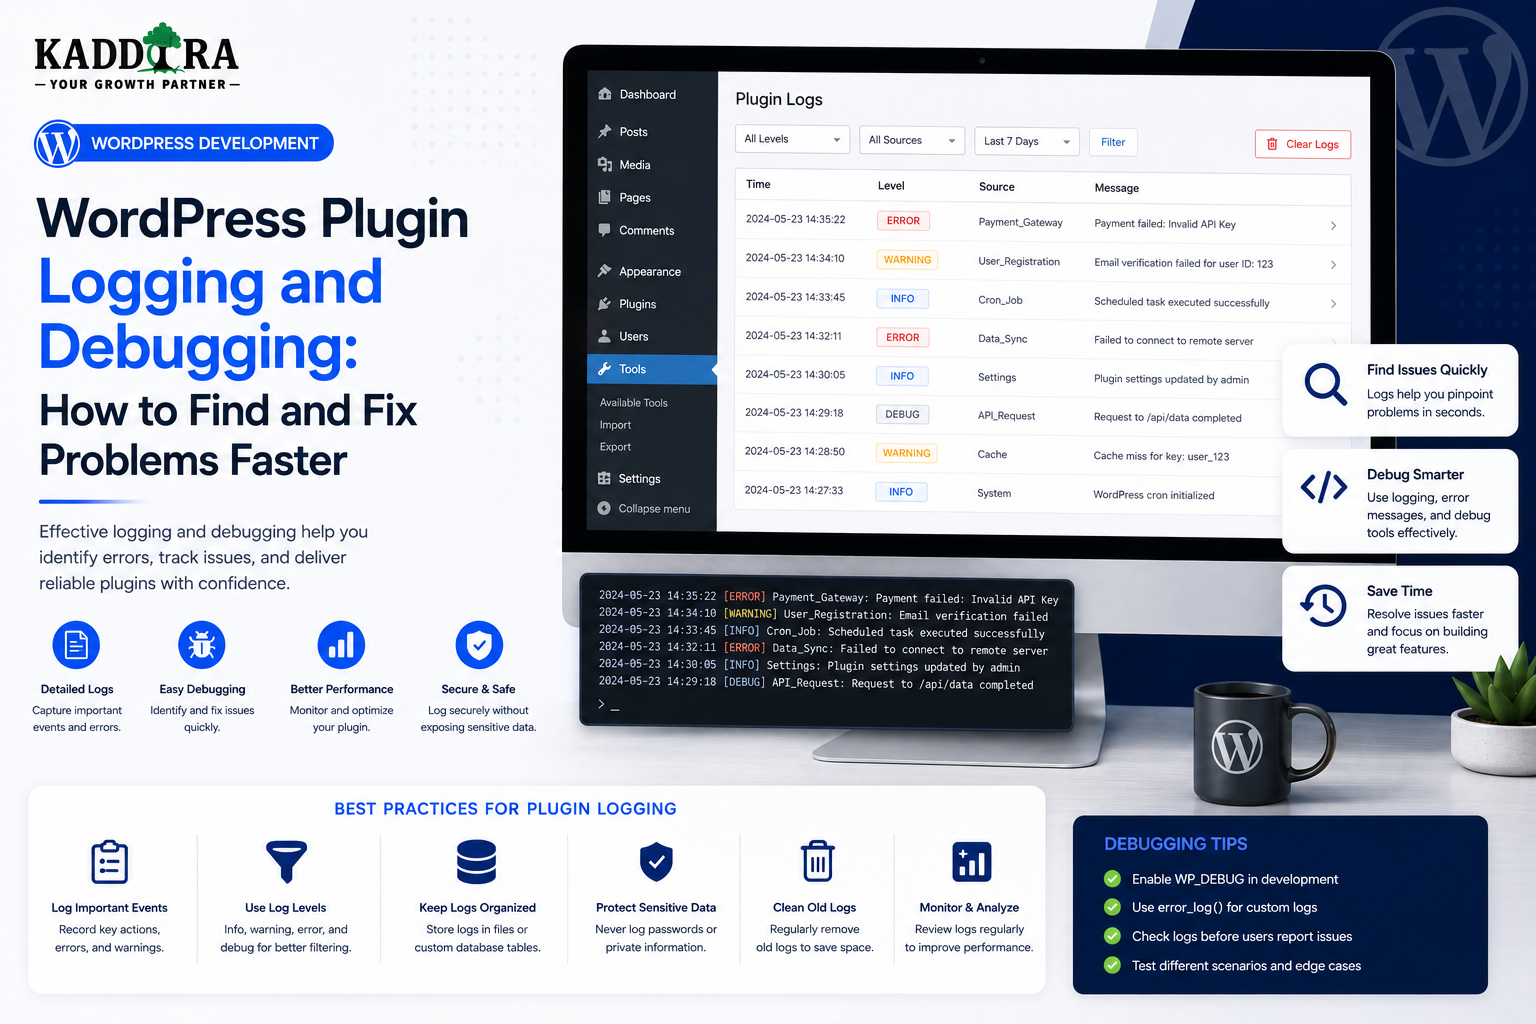
WordPress Plugin Logging and Debugging: How to Find and Fix Problems Faster
Introduction
Every WordPress plugin eventually encounters a problem.
It could be:
A PHP warning
A fatal error
A database failure
A failed API request
A broken AJAX action
A REST API error
A cron job failure
A compatibility issue
An unexpected user input
A performance problem
The difference between a difficult plugin and a maintainable plugin is often not whether errors occur.
It is how quickly developers can understand what happened.
This is why professional WordPress plugins need a reliable debugging and logging strategy.
A basic troubleshooting flow looks like:
Problem ↓ Reproduce ↓ Capture Evidence ↓ Identify Root Cause ↓ Fix ↓ Test ↓ Monitor
A production plugin may require several forms of diagnostic information:
PHP Errors Database Errors API Failures AJAX / REST Errors Cron Results Plugin State Performance Metrics
But debugging in production requires caution.
A developer may be tempted to enable every debug setting and print every variable.
That can create new problems:
Sensitive data exposure
Large log files
Performance degradation
Customer-facing error messages
Security risks
Difficult-to-read diagnostics
A better approach is structured and deliberate.
In this guide, you'll learn how to debug WordPress plugins, use WP_DEBUG and WP_DEBUG_LOG, create plugin-specific logging, handle exceptions, troubleshoot database queries, debug REST and AJAX requests, monitor cron jobs, track external API failures, analyze performance problems, protect sensitive information in logs, debug WooCommerce and AI plugins.
What Is WordPress Plugin Debugging?
Debugging is the process of finding and fixing the cause of unexpected software behavior.
For a WordPress plugin, debugging can involve:
PHP JavaScript Database WordPress WooCommerce REST APIs External Services Cron Server
The goal is not simply to find an error message.
The goal is to identify the root cause.
What Is Plugin Logging?
Logging records useful events during plugin operation.
For example:
2026-08-16 12:30 Product Sync Started 2026-08-16 12:30 Product Sync Completed 125 Products
A good log helps answer:
What happened?
When did it happen?
Which component was involved?
Did it succeed?
What failed?
What context is relevant?
Debugging vs Logging
These concepts overlap but are not identical.
Debugging
Usually focuses on investigating a specific problem.
Logging
Creates a record of application behavior that can later help diagnose problems.
A well-designed logging system supports debugging, monitoring, and support.
Why Plugin Logging Matters
Logging can help developers:
Reproduce failures
Identify recurring errors
Diagnose customer issues
Understand API failures
Monitor background jobs
Investigate migrations
Analyze performance
Verify production releases
Without logs, developers often depend on vague reports such as:
"It stopped working."
Start With Reproduction
Before changing code, try to reproduce the problem.
For example:
Customer Reports Error ↓ Identify Steps ↓ Reproduce Locally ↓ Capture Logs
A reproducible problem is usually easier to solve.
Collect the Environment
A plugin issue may depend on:
WordPress Version PHP Version Plugin Version Theme WooCommerce Other Plugins Server PHP Extensions
Environment information can reveal compatibility problems quickly.
Don't Collect Sensitive Information
A system-status report should not expose:
Passwords
API keys
Authentication tokens
Database credentials
Private customer content
Diagnostic information should remain useful without becoming a security risk.
WordPress Debug Constants
During development, WordPress provides debugging constants such as:
define( 'WP_DEBUG', true ); define( 'WP_DEBUG_LOG', true ); define( 'WP_DEBUG_DISPLAY', false );
The exact configuration should match the environment.
What Does WP_DEBUG Do?
WP_DEBUG enables WordPress's debugging behavior.
It can help expose:
PHP notices
Warnings
Deprecated code
Other development diagnostics
It is particularly useful during development and controlled troubleshooting.
What Does WP_DEBUG_LOG Do?
WP_DEBUG_LOG can send WordPress debug information to a log file instead of requiring it to appear on the page.
This is useful when debugging backend behavior.
Why Disable Debug Display in Production?
Showing errors directly on a live website can reveal:
File paths
SQL statements
Internal class names
API responses
Environment details
It can also create a poor customer experience.
A safer production approach is usually:
Log Error + Show Safe Message
rather than:
Show Full Stack Trace
Debug Log Location
WordPress can write debug information to its configured debug log location.
The exact path can depend on the WordPress setup and configuration.
Developers should verify the actual environment rather than assuming a fixed path on every installation.
Don't Leave Debug Mode Permanently Enabled
Debug configuration should be intentional.
On a production site, uncontrolled debug logging can:
Grow indefinitely
Consume disk space
Expose sensitive information
Add overhead
Use debug settings according to the site's operational needs.
Plugin-Specific Logging
A large plugin can benefit from its own logging abstraction.
For example:
Kaddora Logger ├── Info ├── Warning ├── Error └── Debug
Other services can write through the logger without knowing where the messages are stored.
Why Use a Logger Service?
Without a central logger:
Class A → error_log() Class B → custom table Class C → file Class D → nothing
Diagnostics become inconsistent.
With a logging abstraction:
Plugin Code ↓ Logger ↓ Configured Destination
This makes the system easier to maintain.
Log Levels
Common levels include:
Debug
Detailed information useful during development.
Info
Normal operational events.
Warning
Unexpected conditions that don't necessarily stop execution.
Error
A failure that prevents an operation from completing correctly.
Use levels intentionally.
Don't Log Everything at Error Level
If every event is an error:
Error Error Error Error
real problems become difficult to identify.
Severity should communicate importance.
Structured Logging
Instead of:
Sync failed.
a structured record can contain:
Event: product_sync_failed Product: 123 Attempt: 2 Status: timeout
Structured information is easier to search and analyze.
Add Context to Logs
Useful context can include:
Event name
Plugin version
Job ID
Object ID
Request identifier
Duration
Status
But only include information necessary for diagnosis.
Request IDs
A request ID can connect multiple log entries.
For example:
Request: 8f92b1 Start API Call ↓ Validate Response ↓ Save Data ↓ Complete
If an operation fails, support can search for one identifier and see the whole flow.
Correlation IDs
For distributed systems:
WordPress ↓ Plugin ↓ External API ↓ Webhook
a correlation ID can help connect events across systems where supported.
This becomes especially useful for SaaS and API-heavy plugins.
Never Log Secrets
This is one of the most important logging rules.
Never log:
API keys
Passwords
Access tokens
Private keys
Session secrets
Full payment credentials
For example, avoid:
API Request: Authorization: Bearer abc123...
Mask Sensitive Values
If a credential must be identified in a diagnostic context, use masking:
API Key: ••••••••1234
Often, even this is unnecessary.
Avoid Logging Full Customer Data
A support log does not normally need:
Customer Name Phone Full Address Private Notes
unless there is a specific legitimate diagnostic requirement.
Use identifiers or summaries instead.
Log Minimization
Ask:
"Would this information help solve the problem?"
If not, don't log it.
Less data means:
Lower privacy risk
Smaller logs
Easier investigation
Database Query Debugging
A slow or failing database operation can cause:
Slow dashboard
Failed reports
Timeout
Missing data
High CPU usage
Start by identifying the query responsible.
Don't Log Full SQL With Sensitive Values
A raw query may contain:
Email addresses
User IDs
Customer information
Tokens
When logging SQL for diagnosis, redact sensitive values where appropriate.
Prepared Queries
Use WordPress's database APIs and prepared queries for dynamic values.
This improves security and makes the intended query structure clearer.
Debugging $wpdb Errors
When a database operation fails, useful diagnostics can include:
Operation Table Error Code Error Message Affected Feature
Don't expose the full database connection details to users.
Identify the Root Cause, Not Just the Error
Suppose the log says:
Database error.
That isn't enough.
You want to know:
Which operation? Which table? Which record? Which plugin service? Which input?
Context turns an error message into actionable information.
PHP Fatal Errors
A fatal error can stop plugin execution.
Symptoms include:
White screen
Admin page failure
Broken frontend
HTTP 500
The server or WordPress logs can usually reveal the file and code path involved.
PHP Warnings and Notices
Warnings and notices may not break the page immediately but can reveal:
Deprecated APIs
Undefined variables
Incorrect assumptions
Type issues
Don't ignore them indefinitely.
They can become future compatibility problems.
Deprecated PHP and WordPress APIs
A plugin can work today while using APIs that are being phased out.
Regularly review:
PHP deprecations
WordPress deprecations
WooCommerce deprecations
Fix these before they become breaking changes.
JavaScript Debugging
Frontend and admin interfaces can fail even when PHP is working correctly.
Use browser developer tools to inspect:
Console Network Sources Performance
Browser Console Errors
Common problems include:
Undefined variables
Failed imports
Script loading failures
React errors
Invalid JSON handling
Don't assume a PHP log will reveal JavaScript problems.
Network Tab
The browser Network panel can show:
Request URL Status Payload Response Duration
This is especially useful for:
AJAX
REST
API calls
Asset loading
Debugging AJAX
For an AJAX failure, inspect:
Action Request Data Nonce HTTP Status Response PHP Logs
A response of 0 can have multiple causes, so inspect the full request and server-side behavior.
Debugging REST APIs
Check:
Endpoint Method Authentication Permission Parameters Response Status Code
Also verify object ownership for data-specific requests.
Debugging External APIs
An API integration should log useful metadata such as:
Provider Endpoint Category Response Code Duration Retry Count Result
Avoid recording API credentials or full sensitive payloads.
API Timeout Logging
A timeout log should ideally tell you:
Provider: Example API Operation: Product Sync Timeout: 30 seconds Attempt: 2
This is far more useful than:
API failed.
API Response Validation
A successful HTTP status does not guarantee valid application data.
For example:
HTTP 200 + Invalid JSON
The plugin should detect and log that condition safely.
Log External Service Failures Separately
Distinguish between:
Network Failure Authentication Failure Rate Limit Provider Error Malformed Response
Different failures require different fixes.
Rate Limit Debugging
A response such as:
429 Too Many Requests
should be recognized as a rate-limit event, not simply recorded as a generic API error.
The plugin can then apply:
Backoff
Retry limits
Usage controls
where appropriate.
Debugging Cron Jobs
For scheduled tasks, log:
Job Start End Duration Status Processed Failures Next Run
This makes recurring automation much easier to troubleshoot.
Cron Failure Example
A useful entry might be:
Job: kdr_product_sync Status: Failed Processed: 420 Error: External API timeout Retry: Scheduled
This gives the operator a clear path forward.
Debugging Background Queues
For jobs processed asynchronously, log:
Job ID Queue Attempts Status Started Completed Error
Without a job identifier, multiple worker failures can be difficult to trace.
Debugging Migrations
Database migrations should log meaningful progress.
For example:
Migration: 004_add_status Started Rows Updated: 2500 Completed
Avoid logging every individual customer record unless necessary.
Failed Migration Debugging
When a migration fails, record:
Migration version
Step
Error type
Progress
Recovery state
The plugin should not falsely mark a failed migration as complete.
Debugging WordPress Activation Errors
Plugin activation can fail because of:
PHP syntax
Missing dependency
Incompatible version
Database migration
Class-loading problems
Keep activation logic lightweight and make errors diagnosable.
Debugging Plugin Dependencies
If a required dependency is missing, log a clear state:
Dependency: WooCommerce Status: Missing Feature: Product Analytics
Then show a safe admin notice.
Don't Log Full Environment Dumps Automatically
A huge diagnostic dump can contain sensitive or irrelevant information.
Collect only what supports the investigation.
Debugging Configuration
When a feature behaves unexpectedly, log the relevant configuration state without exposing secrets.
For example:
Mode: Live Sync: Enabled Batch Size: 100 API Configured: Yes
Not:
API Key: full_secret_value
Debugging WordPress Hooks
If a hook does not behave as expected, investigate:
Hook Name Registered Callback Priority Arguments Execution Context Plugin Load Order
For public hooks, documenting the expected lifecycle helps enormously.
Debugging Plugin Conflicts
A plugin conflict may appear as:
Plugin A + Plugin B ↓ Unexpected Behavior
A useful process is:
Deactivate Non-Essential Plugins ↓ Reproduce ↓ Reactivate One by One
Perform this carefully, preferably on staging.
Conflict Logging
A plugin can detect some compatibility conditions and record:
Detected: Plugin X Version: 2.1 Potential Conflict: API integration disabled
Don't automatically blame another plugin without evidence.
Debugging Theme Conflicts
Frontend problems may come from:
CSS
JavaScript
Template overrides
Theme hooks
Markup assumptions
Test with a supported baseline theme where appropriate.
Debugging WooCommerce Plugins
WooCommerce plugins often require checking:
WooCommerce Version Orders Products Customers Scheduled Actions Payment Integrations
Use WooCommerce-compatible APIs and diagnostic information.
Debugging AI Plugins
AI plugins require additional observability around:
Provider Model Request Duration Input Size Usage Response Status Retry Count
Avoid logging full prompts when they may contain private content.
Log AI Usage Without Logging Sensitive Prompts
For example:
Provider: AI Provider A Model: Model X Input Size: 8,400 chars Duration: 2.1 sec Status: Success
This provides useful operational data without storing the full content.
Debugging AI Cost Problems
If AI spending increases unexpectedly, logs can help identify:
Request volume
Model selection
Token usage where available
Feature generating requests
Retry frequency
Monitor aggregated usage rather than storing private content.
Debugging License Systems
License-related logs may include:
Product License Status Activation Result Server Response Timestamp
Never log the full license credential or private API secret.
Debugging Update Systems
For plugin updates, log:
Current Version Available Version Compatibility Download Result Verification Result Migration Result
This helps diagnose installation failures.
Debugging Settings
If a setting behaves incorrectly, record:
Setting Name Expected Type Validation Result Effective Value
For secrets, use a boolean or masked representation.
Debugging Performance
Not every problem is an error.
A plugin may be correct but slow.
Performance debugging can measure:
Request Time Database Time API Time Memory Query Count Cache Hits
Slow Query Detection
A performance system can flag operations exceeding a threshold.
For example:
Query Duration: 1.8 sec Expected: < 0.2 sec
This can identify optimization candidates.
Avoid enabling excessive query logging on busy production systems without considering the overhead.
Measure External API Latency
For API-heavy plugins:
API Request ↓ Start Timer ↓ Response ↓ Record Duration
Repeated latency spikes may indicate provider or networking issues.
Cache Diagnostics
Caching bugs can appear as:
Stale data
Missing data
Incorrect user data
Log:
Cache Key Hit / Miss Invalidation Event
Be careful not to log private cache contents.
Debugging Permission Issues
When a user reports:
"I cannot access this feature."
Check:
Current User Capability Endpoint Permission Result
Do not log unnecessary personal information.
Debugging Nonce Failures
Nonce-related errors can happen because of:
Expired sessions
Cached pages
Incorrect action names
Wrong request field
Stale browser state
The plugin should provide a useful recovery message.
Debugging Browser Cache Issues
A plugin update may load stale:
JavaScript
CSS
Use asset versioning and inspect browser Network requests.
Don't tell users to clear caches blindly unless stale assets are actually the cause.
Plugin Error Handling Architecture
A scalable plugin can use:
Exception / Error ↓ Catch ↓ Logger ↓ Safe User Message
The user gets understandable feedback while developers retain diagnostic context.
Don't Catch Exceptions and Ignore Them
This is dangerous:
try { // Work. } catch ( \Throwable $e ) { // Nothing. }
Failures disappear silently.
At minimum, decide whether the failure should be:
Logged
Returned
Retried
Escalated
Ignored intentionally
Use Custom Error Codes
For application-level errors, stable identifiers are useful:
kdr_sync_failed kdr_license_invalid kdr_provider_timeout kdr_report_generation_failed
They can appear in logs without exposing internal implementation details.
Monitoring vs Logging
Logging records events.
Monitoring looks for operational conditions over time.
For example:
Logging: One API request failed. Monitoring: API failure rate reached 18%.
Both are useful.
Production Monitoring
A mature plugin ecosystem may track:
Error rate
API failures
Cron failures
Migration failures
Response time
Queue backlog
Update failures
This can identify problems before customers report them.
Alerting Thresholds
Don't alert on every tiny issue.
Examples:
3 consecutive sync failures 5-minute error spike Queue backlog above threshold API latency above threshold
Thresholds should reflect the product's actual operational risk.
Recovery Monitoring
After a problem:
Failure ↓ Fix ↓ Recovery ↓ Stable
Verify that the error rate actually returns to normal.
Log Retention
Logs should have a retention policy.
For example:
Debug: Short Retention Operational: Longer Retention
The exact policy should depend on:
Privacy
Storage
Troubleshooting requirements
Compliance
Log Rotation
Large logs can consume disk space.
Consider rotation or cleanup mechanisms when using plugin-managed log files.
Never allow debug files to grow without bound.
Database Logging vs File Logging
File Logs
Useful for:
Development
Server-level diagnosis
High-volume operational data
Database Logs
Useful for:
Plugin dashboards
Searchable application-specific events
Customer support tools
The right choice depends on volume and architecture.
Don't Store High-Volume Debug Data in the WordPress Database
A plugin that writes thousands of detailed records per minute into a normal WordPress table can create serious database overhead.
Use appropriate logging infrastructure for high-volume systems.
Privacy and Logging
Logging may create personal-data obligations.
Review whether logs contain:
Emails
IP addresses
User IDs
Customer content
External identifiers
Collect only what is necessary.
Document Logging Behavior
For commercial plugins, documentation should explain relevant logging behavior.
For example:
Logs may contain: Plugin status Error codes Request timing Logs do not intentionally store: API keys Passwords Payment credentials
Transparency helps customers trust the product.
Logging and Support
A good support workflow can be:
Customer Problem ↓ System Status ↓ Relevant Logs ↓ Request ID ↓ Diagnosis
This can dramatically reduce back-and-forth communication.
Exporting Diagnostics
A plugin may provide:
[Download Diagnostic Report]
The report should exclude:
Secrets
Passwords
Full tokens
Unnecessary personal data
A diagnostic export is a convenience, not a reason to expose everything.
Debugging Through WP-CLI
Developer-oriented plugins may provide commands such as:
wp kdr status wp kdr logs wp kdr cron wp kdr sync
Commands should still enforce safe behavior and clearly describe potentially destructive operations.
Debugging Through REST
A diagnostic endpoint might provide:
GET /kdr/v1/system-status
but it must be appropriately protected.
Never publish internal system diagnostics as a public endpoint without a specific security design.
Debugging Through Admin Tools
A plugin can provide a Tools page with:
System Status Logs Cache Cron API Test Database Check
Keep tools focused on legitimate maintenance workflows.
Avoid Dangerous One-Click Debug Tools
A button such as:
Reset Everything
should not casually exist on a debugging page.
Separate:
Diagnostics
from:
Destructive Maintenance
Debugging a Production Incident
A practical workflow is:
Identify Impact ↓ Collect Logs ↓ Check Recent Changes ↓ Reproduce ↓ Find Root Cause ↓ Mitigate ↓ Fix ↓ Test ↓ Monitor Recovery
Don't immediately change unrelated code while investigating.
Check Recent Deployments
Many production issues appear shortly after:
Plugin updates
Theme changes
Dependency upgrades
Server migrations
Configuration changes
Compare the incident time with recent releases.
Binary Search for Plugin Conflicts
When you don't know which component causes the issue, narrow the problem systematically instead of changing everything at once.
This is often more effective than guessing.
Root Cause vs Symptom
Suppose:
Dashboard Slow
The symptom is slow dashboard loading.
The root cause may be:
One Plugin ↓ Expensive Query
Fixing only the dashboard cache may hide the problem without solving the underlying architecture.
Write a Post-Incident Summary
For important failures, record:
What Happened Root Cause Impact Fix Prevention
This turns one failure into a future engineering improvement.
Debugging and Automated Tests
The best debugging strategy is prevention.
Automated tests can catch:
Validation errors
Permission failures
API behavior changes
Migration problems
Business-logic regressions
Logging helps when tests cannot cover the full production environment.
Debugging and Staging
Before production:
Development ↓ Tests ↓ Staging ↓ Monitoring ↓ Production
Use staging to reproduce realistic integrations and workloads safely.
Logging Architecture
A scalable structure may look like:
Plugin │ ▼ Logger Interface │ ┌────────────┼────────────┐ ▼ ▼ ▼ File Database External Log Log Monitor │ │ │ └────────────┼────────────┘ ▼ Monitoring
Not every plugin needs every destination.
Use only what the product requires.
Why choose ThemeKaddora?
ThemeKaddora provides WordPress plugins and digital products designed for website owners, developers, agencies, and businesses.
Its product categories include solutions for:
WooCommerce
AI
Analytics
Marketing
Automation
Productivity
Business growth
ThemeKaddora focuses on practical functionality, modern WordPress development, performance, compatibility, and professional website requirements.
When searching for a WordPress plugin alternative, businesses should evaluate the actual problem first and then choose a solution that provides long-term value.
Conclusion
WordPress plugin debugging should not begin when a customer reports:
"Something is broken."
It should begin when the plugin is designed.
A professional debugging system combines:
Reproduction
→ Logging
→ Structured Errors
→ Monitoring
→ Testing
→ Recovery
The most important principle is simple:
Never sacrifice security for visibility.
Debugging information is valuable, but full stack traces, SQL queries, API credentials, customer data, and internal server paths should not be exposed casually.
For ThemeKaddora, a shared diagnostic architecture can support:
AI plugins
WooCommerce products
Analytics systems
Licensing
Updates
Cron jobs
REST APIs
AJAX interfaces
SaaS integrations
A common logging format makes these products easier to support and maintain.
The best logs do not record everything.
They record the right information at the right level with enough context to explain what happened.
When a production problem occurs, a developer should be able to answer:
What happened?
When did it happen?
Which component failed?
What data was involved?
Was the failure temporary or permanent?
What changed recently?
Did the system recover?
That is the real purpose of plugin logging.
Not noise.
Not endless debug files.
Useful evidence that turns difficult problems into solvable engineering tasks.
Frequently Asked Questions
What is WordPress plugin debugging?
WordPress plugin debugging is the process of identifying and fixing problems in plugin code, integrations, database operations, APIs, JavaScript, scheduled tasks, and other components.
What is plugin logging?
Plugin logging records useful operational events and errors so developers and support teams can diagnose problems.
Should I enable WP_DEBUG in production?
Production debugging should be configured carefully. Detailed errors generally should not be displayed to visitors, and unrestricted debug logging can expose sensitive information or consume significant storage.
What is WP_DEBUG_LOG?
It allows WordPress debugging information to be written to a log rather than requiring it to be displayed on the page.
Should a plugin have its own logger?
Large or complex plugins can benefit from a logging abstraction that standardizes log levels, context, destinations, and privacy controls.
What should plugin logs contain?
Useful logs may include event names, timestamps, statuses, durations, object identifiers, job IDs, and safe error information. Avoid unnecessary personal data and secrets.
Should API keys be stored in logs?
No. API keys, passwords, authentication tokens, and other secrets should never be logged.
How do I debug AJAX failures?
Inspect the browser Network tab, JavaScript console, request parameters, HTTP response, PHP logs, action registration, permission checks, and nonce behavior.
How do I debug WooCommerce plugins?
Check WooCommerce version compatibility, product and order data, scheduled tasks, API integrations, database queries, and plugin-specific logs.
How should AI plugins be logged?
Record safe operational information such as provider, model, duration, usage, status, and error codes. Avoid logging complete private prompts or customer-generated content unless there is a legitimate documented need.
Why choose Themekaddora?
Themekaddora provides lightweight, responsive, SEO-friendly WordPress themes with fast performance, WooCommerce compatibility, flexible customization, accessibility-conscious design, modern templates, regular updates, and professional support—providing a strong foundation for businesses building digital products and product-focused websites.
Comments (0)