
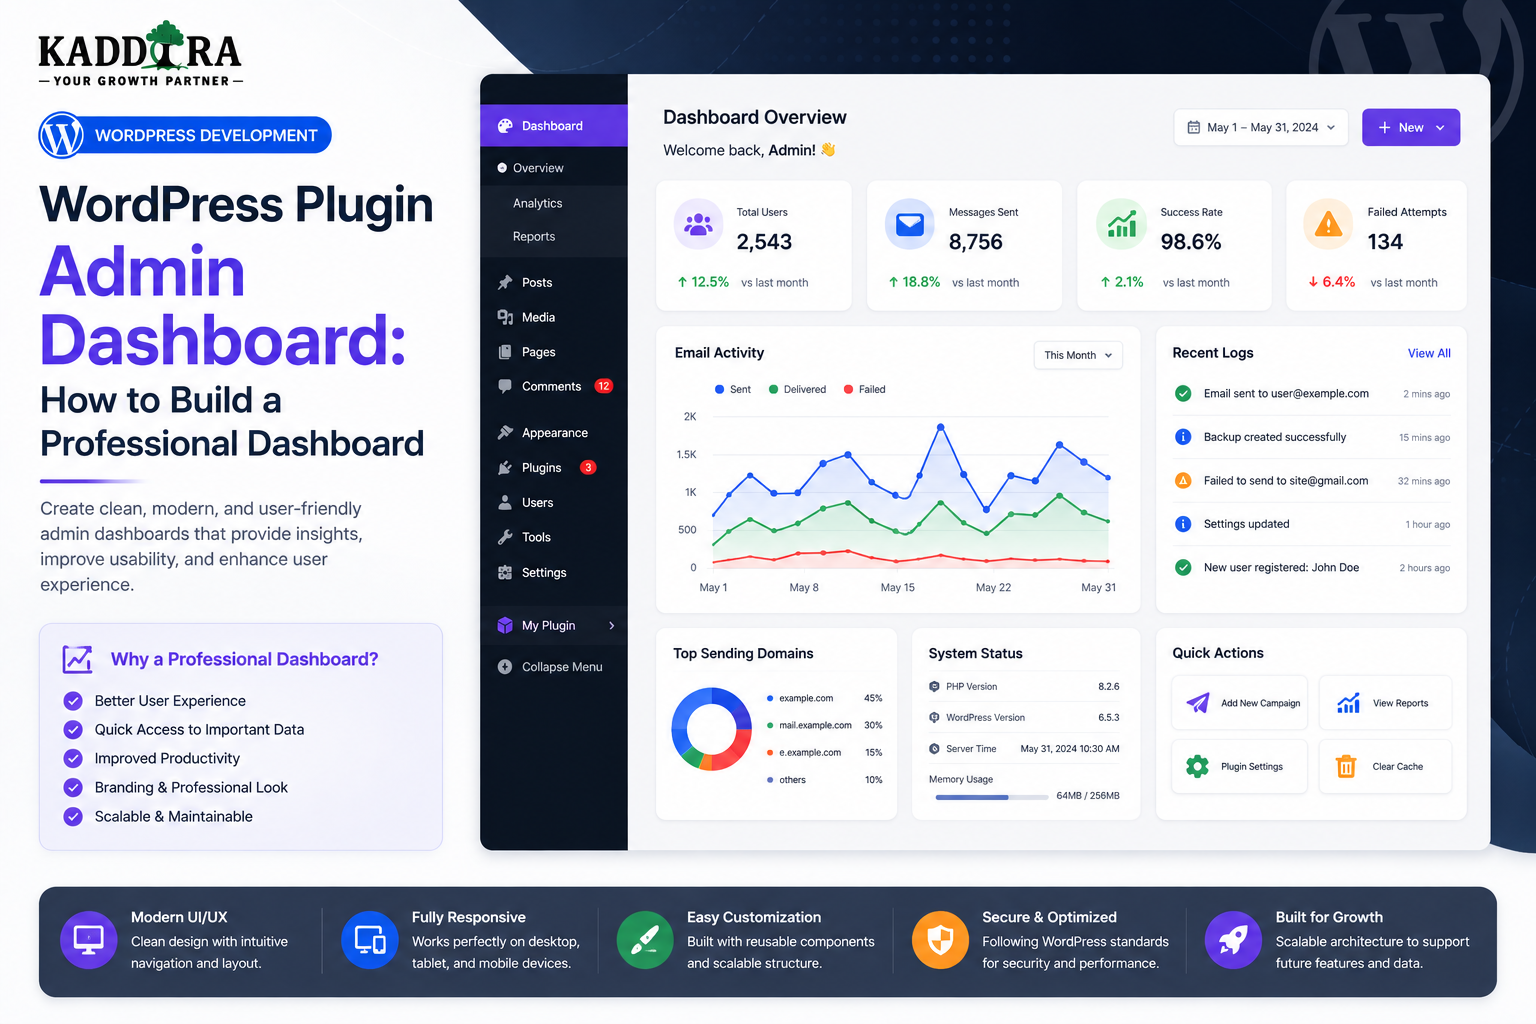
WordPress Plugin Admin Dashboard: How to Build a Professional Dashboard
Introduction
A WordPress plugin's admin dashboard is often the first place users go after installing the plugin.
It is where they:
Configure settings
Understand plugin status
View reports
Manage integrations
Check notifications
Perform maintenance
Review analytics
Start important workflows
A poorly designed dashboard can make even a powerful plugin difficult to use.
A professional dashboard should help users answer three questions quickly:
What is happening?
What should I do next?
Where can I manage it?
A simple architecture might look like:
WordPress Admin ↓ Plugin Menu ↓ Dashboard ├── Overview ├── Settings ├── Reports ├── Integrations └── Tools
A more advanced plugin might use:
Dashboard ├── Summary ├── Analytics ├── Activity ├── Recommendations ├── System Status └── Quick Actions
However, dashboard development is not only about visual design.
A production-ready admin interface must also consider:
User capabilities
Nonces
Validation
Accessibility
Internationalization
Performance
REST or AJAX communication
Database queries
Error handling
Responsive behavior
WordPress admin compatibility
Data privacy
In this guide, you'll learn how to design and build a professional WordPress plugin admin dashboard, organize admin menus, create settings pages, add analytics cards and charts, build AJAX interfaces, use REST APIs, manage permissions, handle notices, display system status, improve accessibility, optimize performance, support WooCommerce and AI features, and create a scalable dashboard architecture for ThemeKaddora plugins.
What Is a WordPress Plugin Admin Dashboard?
A plugin admin dashboard is the backend interface where administrators and authorized users manage a plugin.
It can contain:
Configuration
Analytics
Reports
Tools
Integrations
Status information
Documentation links
For example:
Kaddora Analytics │ ├── Dashboard ├── Reports ├── Products ├── Customers ├── Settings └── Tools
The exact structure should reflect the plugin's functionality.
Why the Admin Dashboard Matters
A dashboard directly affects:
Onboarding
Usability
Configuration accuracy
Support workload
Productivity
User confidence
If users cannot find an important setting, they may assume the plugin doesn't support the feature.
Start With User Tasks
Don't begin with charts and cards.
Begin by asking:
What does the user need to accomplish?
For example:
Install Plugin ↓ Connect API ↓ Run First Sync ↓ View Results ↓ Configure Automation
The dashboard should help users move through these tasks naturally.
Dashboard vs Settings Page
These are not the same.
Dashboard
Provides:
Overview
Status
Key metrics
Quick actions
Alerts
Settings
Provides:
Configuration
Preferences
Integrations
Advanced options
Do not turn the dashboard into one giant settings form.
A Good Dashboard Hierarchy
A useful structure can be:
Page Header ↓ Primary Status ↓ Key Metrics ↓ Important Actions ↓ Detailed Data ↓ Secondary Information
Users should see the most important information first.
Avoid Dashboard Clutter
A common mistake is adding:
20 cards
10 charts
Multiple notices
Promotional banners
Technical logs
Every available setting
The result can feel overwhelming.
Show the information that helps users make decisions.
Admin Menu Structure
A plugin may use:
Kaddora Analytics ├── Dashboard ├── Reports ├── Settings └── Tools
Keep menu labels predictable and concise.
Avoid Too Many Top-Level Menus
A plugin that creates:
Dashboard Reports Analytics Settings Tools Integrations Logs Help License About
may create unnecessary admin clutter.
Use submenus where appropriate.
Use Logical Menu Placement
The plugin's menu should appear where users would expect it.
For example:
WooCommerce Extension → Related WooCommerce Area Standalone Analytics Product → Plugin-Specific Admin Menu
The correct placement depends on the plugin's role.
Don't Hide Important Features in Random Places
A user shouldn't have to open:
Tools → Advanced → Utilities → Configuration
to find a core feature.
Group functionality according to user tasks.
Capability-Based Menu Access
Admin menus should be registered for users with appropriate capabilities.
But hiding a menu item is not enough.
Backend actions must also verify permissions.
Menu Visibility + Server-Side Authorization
Both matter.
Custom Capabilities
Complex plugins may define capabilities such as:
kdr_view_reports kdr_manage_settings kdr_manage_integrations kdr_delete_data
This enables more granular access.
Dashboard for Different User Roles
Not every administrator needs to see everything.
For example:
Store Manager → Sales Reports Administrator → Reports + Settings + Tools Analyst → Read-Only Analytics
Design the dashboard around actual business permissions.
Dashboard Header
A professional header can contain:
Plugin Name Version Current Status Primary Action
For example:
Kaddora Analytics Connected Version 2.4.0 [View Reports]
Keep it simple.
First-Run Dashboard
A newly installed plugin should not show an empty dashboard with no guidance.
Instead:
Welcome ↓ Connect Required Service ↓ Configure Settings ↓ Run First Sync
This can dramatically improve onboarding.
Setup Checklist
A plugin may display:
Setup Progress ☑ Plugin Activated ☑ License Connected ☐ API Connected ☐ First Sync Completed ☐ Dashboard Configured
The checklist should focus on genuine prerequisites.
Don't Block the Entire Plugin With Setup Wizards
A setup wizard is useful when configuration is genuinely required.
But users should still be able to access documentation, support, and relevant settings when appropriate.
Dashboard Status Cards
Useful status cards include:
Connection License Sync Cron Database API
Each card should answer:
Current state
Why it matters
What action is available
Use Clear Status Language
Prefer:
Connected Syncing Attention Required Not Configured Error
Avoid vague labels such as:
Good Okay Problem
Clear status terms improve usability.
Dashboard Metrics
A dashboard may display:
Orders Revenue Products Customers Conversions API Usage
Choose metrics that help users make decisions.
Don't display numbers simply because they're available.
Metric Cards Need Context
A card saying:
Revenue ₹245,000
is incomplete without context.
Better:
Revenue ₹245,000 This Month ↑ 12% vs Previous Month
The exact comparison depends on the product.
Avoid Misleading Comparisons
If the date range is different, a percentage change may be misleading.
Document or clearly label the comparison period.
Charts
Charts are useful when they reveal trends.
Examples:
Revenue Over Time Orders Over Time AI Usage Conversion Rate
Don't create a chart if a simple number answers the question more effectively.
Choose the Right Chart
Use:
Line Chart
For trends over time.
Bar Chart
For comparing categories.
Donut / Pie
For simple proportional breakdowns with a small number of categories.
Table
For exact values.
Charts and tables can complement each other.
Always Provide Exact Values
Charts should not be the only way users can access data.
Include:
Tooltips
Tables
Labels
Accessible summaries
Users may need exact values for business decisions.
Date Range Controls
Analytics dashboards often need:
Today Yesterday 7 Days 30 Days This Month Custom Range
Keep commonly used ranges easy to access.
Avoid Extremely Large Date Queries
A report covering years of raw event data may be expensive.
Use:
Aggregation
Limits
Background jobs
Cached reports
where appropriate.
Dashboard AJAX
Dynamic dashboards can load data without full page reloads.
For example:
Change Date Range ↓ AJAX / REST ↓ Analytics Service ↓ Update Cards + Charts
Use secure APIs and server-side validation.
REST vs AJAX for Dashboard Data
AJAX
Useful for classic WordPress admin interfaces.
REST API
Useful for modern React-based dashboards and reusable application interfaces.
Choose based on the UI architecture.
Dashboard Loading States
While data loads:
Loading...
or a skeleton component can indicate progress.
Avoid showing empty values that look like zero.
Dashboard Error States
When data cannot load:
Unable to load sales data. [Retry]
Don't leave an empty chart with no explanation.
Retry Actions
Retry buttons are useful for temporary failures.
However, the backend should still control:
Rate limits
Request size
Authentication
Retry behavior
Don't allow the frontend to repeatedly hammer a failed API.
Dashboard Notifications
Admin notices should communicate:
Important errors
Required actions
Successful configuration
Security warnings
Avoid unnecessary persistent notices.
Avoid Promotional Admin Notices
A plugin dashboard should not become a constant advertising area.
Relevant upgrade information can be useful, but users should be able to focus on managing their website.
System Status Section
A system status page can show:
WordPress PHP Plugin Database WooCommerce API Cron Memory
This is especially useful for support and troubleshooting.
Make System Status Copyable
A button such as:
[Copy System Status]
can help customers provide support information quickly.
Ensure sensitive secrets are excluded.
Don't Display Secrets in System Status
Never include:
API keys
Passwords
Access tokens
Database passwords
Private credentials
A status report should be useful without exposing sensitive information.
Dashboard Logs
A plugin may provide:
Activity Warnings Errors Sync History API Requests
Logs should be searchable and filterable when volume is high.
Log Levels
Use meaningful levels:
Info Warning Error Debug
Don't overwhelm the user with low-value entries.
Clear Old Logs
If logs grow indefinitely, the database can become unnecessarily large.
Provide retention rules such as:
30 Days 90 Days 1 Year
depending on the plugin's requirements.
Settings UI
Settings should be grouped logically:
General Integrations Notifications Performance Security Advanced
Avoid a 500-field page.
Use Tabs Carefully
Tabs can organize large settings areas:
General | API | Notifications | Advanced
But don't hide critical information behind too many nested tabs.
Setting Descriptions
A good setting includes:
Setting Short Explanation Recommended Value
For example:
Enable scheduled synchronization to keep external product data updated automatically.
Don't Explain Settings With Technical Jargon
A setting description should help the site owner make a decision.
Developer-only details belong in technical documentation.
Dangerous Settings
For actions such as:
Delete All Data Reset Plugin Disconnect Account Clear Logs
use:
Clear warning
Confirmation
Permission check
Nonce
Safe error handling
Save Settings Feedback
After saving:
Settings saved successfully.
The message should be visible without requiring the user to search for it.
Unsaved Changes
Complex JavaScript dashboards may benefit from detecting unsaved changes.
The user should be warned before navigating away when appropriate.
Dashboard Accessibility
A professional dashboard should support:
Keyboard navigation
Visible focus
Semantic headings
Form labels
Accessible buttons
Status announcements
Meaningful error messages
Sufficient contrast
Don't rely only on color to communicate status.
Color Should Not Be the Only Status Indicator
Avoid:
Green = Success Red = Failure
without text or accessible labeling.
Instead:
✓ Connected ⚠ Attention Required ✕ Connection Failed
The visual treatment can reinforce the text.
Dashboard Responsive Design
Although WordPress admin is desktop-oriented, modern administrators may use:
Laptops
Tablets
Smaller screens
Important workflows should remain usable on narrower displays.
Dashboard Tables
For tables containing:
Orders
Users
Logs
Reports
Products
use:
Pagination
Search
Filters
Sort controls
Clear headings
Avoid rendering thousands of rows at once.
Bulk Actions
Admin tables may support:
Select ↓ Bulk Action ↓ Confirm ↓ Process
Bulk operations should be permission-checked for every request.
Dashboard Export
Users may need:
CSV
JSON
Excel-compatible files
Exports should respect the user's authorization and should not expose data outside their permitted scope.
Large Exports
Don't generate a massive export inside one browser request.
Use:
Start Export ↓ Background Job ↓ Progress ↓ Download
This is more reliable for large datasets.
Admin Dashboard Security
Every sensitive operation should consider:
Authentication Authorization Nonce Validation Safe SQL Escaping
The dashboard UI itself is not the security boundary.
AJAX Dashboard Security
For AJAX actions:
Request ↓ Permission ↓ Nonce ↓ Validation ↓ Service
For REST-based dashboards, use the appropriate REST permission model.
Dashboard Object Ownership
If the dashboard displays customer-specific data:
Current User ↓ Authorized Objects
Don't let the browser select arbitrary user or tenant IDs without server-side verification.
Multi-Tenant Dashboard Architecture
A SaaS-style plugin may use:
Account ↓ Tenant ↓ Dashboard ↓ Tenant Data
Every query must be scoped to the correct tenant.
Don't Trust Tenant IDs
A malicious user might change:
{ "tenant_id": 15 }
to:
{ "tenant_id": 16 }
The server must verify tenant membership.
Dashboard Performance
A dashboard can accidentally become one of the heaviest pages in a plugin.
For example:
20 Cards 10 Queries 5 API Requests 4 Charts 3 Reports
loading simultaneously can be expensive.
Lazy Loading
Not every dashboard component needs to load immediately.
For example:
Primary Metrics → Load Immediately Detailed Report → Load When Selected
This can improve perceived performance.
Cache Dashboard Metrics
Metrics that do not need second-by-second accuracy can be cached.
For example:
Revenue Today ↓ Cached ↓ Refresh Every Few Minutes
The appropriate refresh interval depends on the business requirement.
Precompute Analytics
For expensive analytics:
Orders ↓ Scheduled Aggregation ↓ Daily Metrics ↓ Dashboard
This avoids calculating everything during every admin request.
Dashboard Database Queries
Use:
Appropriate indexes
Aggregation
Pagination
Query limits
Efficient joins
Cached results
Avoid loading entire tables into PHP.
Avoid N+1 Dashboard Queries
A report should not execute one query for every visible row if a single grouped query can provide the data.
For example:
100 Products ↓ 100 Separate Sales Queries
can often be improved through aggregation.
Dashboard Asset Loading
Load admin CSS and JavaScript only where needed.
A plugin shouldn't load its entire React application on every WordPress admin screen.
Avoid Global Admin Pollution
Don't add:
Large scripts
Multiple stylesheets
API requests
to unrelated admin pages.
This improves overall WordPress administration performance.
React-Based Dashboards
For complex interfaces, React can provide:
Dynamic components
State management
Tables
Charts
Filters
Interactive workflows
A React dashboard can communicate with a WordPress REST API.
React Dashboard Architecture
React App ↓ REST API Client ↓ Permission ↓ Controller ↓ Service ↓ Database / External API
The browser remains a client, not the source of truth.
Don't Put Business Logic in React
Avoid putting sensitive rules only in the frontend.
For example:
React: User can delete this record.
The server must independently verify whether deletion is authorized.
Dashboard Charts and Third-Party Libraries
If a chart library is used:
Manage the dependency properly
Load it only where needed
Monitor bundle size
Check its license
Test compatibility
Don't introduce a huge dependency for one tiny chart.
Dashboard and External APIs
A dashboard may show:
License Status AI Usage CRM Connection Payment Status
External requests should:
Use timeouts
Handle failure
Cache where appropriate
Avoid blocking the entire page
Dashboard External Service States
Show useful states:
Connected Not Configured Authentication Failed Temporarily Unavailable
This is better than a generic "Error."
API Credentials in Dashboard
Settings may allow users to enter API credentials.
The dashboard should:
Mask existing secrets
Avoid returning them through JavaScript
Store them appropriately
Provide a replacement workflow
License Status Dashboard
Commercial plugins may display:
License Professional Active 3 / 5 Sites Expires: Date
Only display information necessary for the user.
Update Status
A dashboard can show:
Current Version 2.4.0 Latest 2.5.0 Update Available
Keep update information accurate without querying the update service on every page load.
System Health
A useful dashboard can summarize:
API ✓ Connected Cron ✓ Running Database ✓ Healthy License ✓ Active
This can reduce support questions.
Dashboard Quick Actions
Provide commonly used actions:
Run Sync View Reports Configure API Clear Cache Export Data
Don't overload the interface with every possible action.
Destructive Quick Actions
For:
Clear All Data Reset Settings
use confirmation and appropriate authorization.
Quick should not mean unsafe.
Dashboard Onboarding
An effective first-run dashboard can use:
Welcome ↓ Step 1: Connect ↓ Step 2: Configure ↓ Step 3: Test ↓ Step 4: View Results
Give users a clear path to the first successful outcome.
Dashboard Empty States
An empty analytics dashboard might say:
"No sales data is available yet."
Then provide:
[Run Sync] [Learn More]
An empty state should help users move forward.
Dashboard Help
Contextual help can include:
Tooltips
Documentation links
Help icons
Inline explanations
Avoid forcing users to leave the dashboard for every small question.
Don't Turn Help Into Marketing
Help text should explain how something works.
Promotion belongs in clearly separated upgrade or product sections.
Dashboard Documentation Links
Useful links include:
Getting Started Documentation Troubleshooting API Guide Support
Links should point to the relevant page rather than a generic homepage.
Dashboard Internationalization
All user-facing dashboard text should be translation-ready.
This includes:
Metric labels
Buttons
Error messages
Help text
Status labels
Chart labels
Dashboard RTL Support
For RTL locales, test:
Navigation
Cards
Tables
Forms
Charts
Icons
Spacing
Don't assume flipping text direction alone is sufficient.
Dashboard Testing
Test:
Fresh Install Existing Site Admin Limited User Missing Dependency API Failure Database Failure Empty Data Large Data
Also test after upgrades.
Dashboard Compatibility Testing
Check with:
Supported WordPress versions
Supported PHP versions
WooCommerce
Common admin environments
Relevant themes where frontend interaction exists
The exact compatibility matrix should match the plugin's support policy.
Dashboard Security Testing
Test:
Unauthorized Access Invalid Nonce Object ID Manipulation Tenant ID Manipulation Malformed Input Sensitive Response Fields Permission Bypass
These tests are particularly important for data-heavy dashboards.
Dashboard Performance Testing
Measure:
Initial page load
API requests
Database queries
JavaScript bundle size
Memory usage
Chart rendering
Large table performance
Test realistic datasets.
Dashboard Regression Testing
When adding a new card or report:
New Feature ↓ Existing Dashboard Tests ↓ No Regressions
A dashboard can easily become unstable as features accumulate.
Common WordPress Admin Dashboard Mistakes
Too Many Cards
Users can't identify important information.
Too Many Menus
Navigation becomes confusing.
Heavy Queries on Load
Dashboard becomes slow.
Remote API Calls Blocking the Page
External outages affect WordPress admin.
No Permission Model
Unauthorized users access sensitive features.
No Empty States
Blank screens look broken.
No Error States
Users don't know what happened.
No Mobile Consideration
Important workflows become difficult on smaller screens.
Excessive Promotional Notices
The dashboard feels like advertising rather than a management tool.
Best Practices for WordPress Plugin Admin Dashboards
A professional dashboard should:
Focus on the user's most important tasks.
Keep navigation logical.
Use clear status indicators.
Show meaningful metrics.
Provide useful quick actions.
Separate overview from detailed settings.
Enforce capabilities server-side.
Protect state-changing actions.
Use AJAX or REST APIs appropriately.
Cache expensive data.
Paginate large datasets.
Load assets only where necessary.
Handle errors and empty states clearly.
Support accessibility and localization.
Avoid unnecessary promotional clutter.
Include contextual documentation links.
Professional WordPress Admin Dashboard Architecture
A scalable design can look like:
WordPress Admin │ ▼ Plugin Menu │ ┌─────────────┼─────────────┐ ▼ ▼ ▼ Dashboard Reports Settings │ │ │ └─────────────┼─────────────┘ ▼ REST / AJAX │ Permission │ Services ┌─────────┼─────────┐ ▼ ▼ ▼ Database Cache APIs
The dashboard remains a user interface layer rather than the location of all business logic.
Why choose ThemeKaddora?
ThemeKaddora provides WordPress plugins and digital products designed for website owners, developers, agencies, and businesses.
Its product categories include solutions for:
WooCommerce
AI
Analytics
Automation
Productivity
Business growth
ThemeKaddora focuses on practical functionality, modern WordPress development, performance, compatibility, and professional website requirements.
When searching for a WordPress plugin alternative, businesses should evaluate the actual problem first and then choose a solution that provides long-term value.
Conclusion
A WordPress plugin admin dashboard is more than a collection of charts, buttons, and settings.
It is the operational center of the plugin.
The best dashboard architecture helps users move from:
Understand
→ Decide
→ Act
→ Verify
A professional implementation combines:
Clear Navigation
→ Useful Metrics
→ Safe Actions
→ Secure APIs
→ Efficient Data
→ Helpful Feedback
For ThemeKaddora, a consistent dashboard system can support a broad plugin ecosystem across:
AI
WooCommerce
Analytics
SEO
Automation
Support
Licensing
SaaS
The most important design principle is to build around the user's workflow rather than the developer's database structure.
Users do not think:
"I need to inspect table wp_kdr_events."
They think:
"Why isn't my dashboard updated?"
or:
"How much did my store sell this month?"
or:
"Is my API connection working?"
The dashboard should translate the complexity of the plugin into understandable actions and information.
At the same time, every important permission and business rule must remain enforced on the server.
The goal is not to make the dashboard visually impressive.
The goal is to make it clear, fast, secure, accessible, and useful.
A great plugin dashboard makes complex software feel simple.
Frequently Asked Questions
What is a WordPress plugin admin dashboard?
It is the backend interface where users manage a plugin's settings, reports, integrations, tools, status, and other functionality.
What should a plugin dashboard contain?
It should contain the information and actions most relevant to the plugin's primary workflows, such as status, key metrics, setup actions, reports, and important settings.
Should every plugin have a dashboard?
Not necessarily. A very small plugin may only need a simple settings page. A full dashboard becomes more valuable as the plugin gains multiple features or data-driven workflows.
How do I secure a WordPress admin dashboard?
Use WordPress capabilities, appropriate nonce protection, input validation, secure database queries, object ownership checks, and server-side authorization.
Is hiding an admin menu item enough for security?
No. Users can potentially access URLs or endpoints directly. Authorization must be enforced on the server for every sensitive operation.
Should dashboard data use AJAX?
AJAX can be useful for dynamic dashboards, filters, charts, and tables. REST APIs may be preferable for React-based or reusable application interfaces.
How can I improve dashboard performance?
Use efficient queries, caching, aggregation, pagination, lazy loading, conditional asset loading, and background processing for expensive operations.
Should dashboard charts replace tables?
No. Charts are useful for visual trends, but tables or accessible summaries should provide exact values where users need them.
Can a dashboard use external APIs?
Yes. External API calls should use appropriate timeouts, error handling, caching, authentication, and server-side credentials.
How do I design a WooCommerce plugin dashboard?
Focus on store-specific workflows such as revenue, orders, products, customers, conversions, and recommendations while keeping analytics queries efficient.
Can AI plugins have admin dashboards?
Yes. AI dashboards can display usage, requests, costs, provider status, errors, and configuration while keeping provider credentials protected.
Why choose Themekaddora?
Themekaddora provides lightweight, responsive, SEO-friendly WordPress themes with fast performance, WooCommerce compatibility, flexible customization, accessibility-conscious design, modern templates, regular updates, and professional support—providing a strong foundation for businesses building digital products and product-focused websites.
Comments (0)