
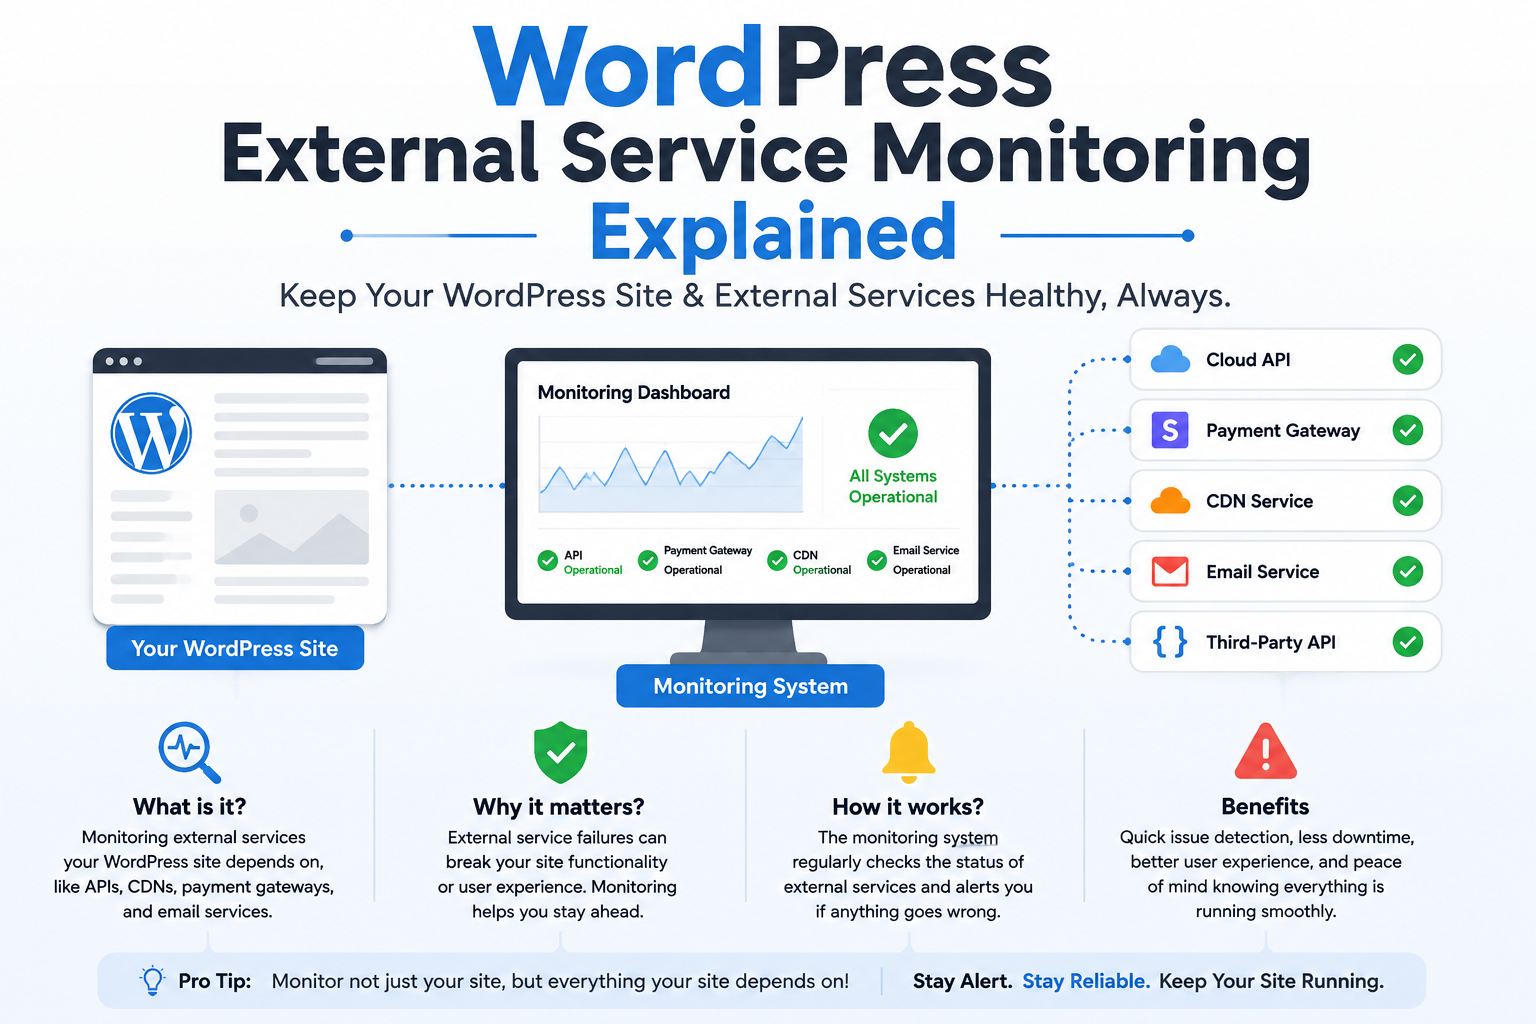
WordPress External Service Monitoring Explained: Complete Guide
Introduction
Modern WordPress plugins rarely operate completely on their own.
A plugin may depend on external services for:
APIs
AI
CRM
ERP
Payments
Analytics
Shipping
Authentication
Cloud storage
Marketing automation
A typical integration might look like:
WordPress ↓ API Client ↓ External Service
As long as the external service works, the integration may appear healthy.
But when something goes wrong, the problem can be difficult to identify.
For example:
API = Slow Webhook = Delayed OAuth = Expired Queue = Growing Sync = Stalled Provider = Rate Limited
The website itself may still load normally.
This is why monitoring an external integration requires more than checking whether WordPress is online.
You need to know:
Is the provider reachable? Is authentication working? Are requests becoming slower? Are errors increasing? Are webhooks arriving? Is synchronization progressing? Is the queue processing? Are rate limits being reached? Is the provider experiencing an outage?
This is the purpose of external service monitoring.
A useful architecture is:
WordPress Integration │ ┌─────────────────┼─────────────────┐ ▼ ▼ ▼ API Webhook Sync │ │ │ └─────────────────┼─────────────────┘ ▼ Monitoring │ ┌─────────┴─────────┐ ▼ ▼ Metrics Alerts │ │ └─────────┬─────────┘ ▼ Dashboard
The goal is to monitor the signals that help you detect problems early, understand their cause, and recover safely.
This guide explains what external-service monitoring is, what should be monitored, how to track uptime and latency, how to detect provider outages, how to monitor API errors and rate limits, how to monitor webhooks and synchronization, how to design alerts, how to avoid excessive monitoring traffic.
What Is External Service Monitoring?
External service monitoring is the process of observing the availability, performance, reliability, and behavior of services that a WordPress application depends on.
Examples include:
CRM API Payment API AI API Email API ERP API Analytics API
A monitoring system collects signals about these dependencies and determines whether they are operating normally.
Why External Service Monitoring Matters
Suppose a CRM API becomes slow.
Without monitoring:
CRM Slows Down ↓ Sync Becomes Slow ↓ Customers See Stale Data ↓ Admin Notices Later
With monitoring:
CRM Latency Increases ↓ Warning Triggered ↓ Admin Investigates ↓ Issue Detected Earlier
Monitoring changes the operating model from reactive to proactive.
External Service Monitoring vs Integration Health
These concepts are related but not identical.
External Service Monitoring
Focuses on:
Provider Availability Latency Errors Rate Limits
Integration Monitoring
Focuses on:
Provider + Credentials + Webhooks + Queues + Synchronization + Local Processing
External service monitoring is one part of complete integration observability.
What Should You Monitor?
A useful monitoring model includes:
1. Availability 2. Latency 3. HTTP Errors 4. Authentication Failures 5. Rate Limits 6. Request Volume 7. Webhook Delivery 8. Synchronization 9. Queue Processing 10. Data Freshness 11. Provider Status 12. Dependency Health
Not every integration needs every metric.
1. Monitor Service Availability
The simplest metric is:
Can WordPress reach the external service?
A health request can determine whether the provider responds.
For example:
WordPress ↓ GET /account ↓ Provider ↓ Response
Availability Does Not Mean Full Functionality
A provider may respond with:
200 OK
while the functionality your integration needs is failing.
For example:
Account API = Working Webhook Delivery = Broken
Therefore, availability is necessary but not sufficient.
2. Monitor HTTP Status Codes
Track responses such as:
2xx → Success 3xx → Redirect 4xx → Client / Authentication / Business Error 5xx → Provider / Server Error
The exact meaning depends on the API.
Important Error Codes
Common signals include:
401 403 404 409 422 429 500 502 503 504
Each can represent a different problem.
401 Monitoring
Repeated 401 responses may indicate:
Expired access tokens
Revoked credentials
Incorrect authentication
Provider-side authorization changes
Track the rate rather than treating one isolated 401 as a major incident.
403 Monitoring
Repeated 403 responses may indicate:
Missing scopes
Permission changes
Account restrictions
Provider policy changes
This may require administrator intervention rather than retries.
404 Monitoring
A 404 can mean:
Resource deleted
Wrong endpoint
Provider API change
Incorrect external ID
The correct response depends on the operation.
409 Monitoring
A 409 may indicate a resource conflict.
This can be especially important for synchronization systems.
Monitor whether conflicts are increasing.
422 Monitoring
A 422 may represent invalid business data.
If the same request repeatedly generates 422, automatic retries are usually not the correct solution.
429 Monitoring
429 Too Many Requests is one of the most important external-service signals.
It indicates that the application is approaching or exceeding a provider-defined rate limit.
Monitor:
429 Count Retry-After Requests Per Window Affected Connections
5xx Monitoring
Track:
500 502 503 504
These often indicate temporary provider or infrastructure problems, although the exact cause varies.
A sudden increase in 5xx responses across many tenants can indicate a provider incident.
3. Monitor Latency
An API can be technically available but unusably slow.
For example:
Normal: 250 ms Warning: 1,500 ms Severe: 5,000 ms
The thresholds should be based on the actual provider and business workflow.
Average Latency Is Not Enough
Suppose:
99 requests = 200 ms 1 request = 30 seconds
The average may hide a serious tail-latency problem.
Monitor percentiles where possible:
P50 P95 P99
Why P95 and P99 Matter
P95 indicates the approximate experience of the slower 5% of requests.
P99 focuses on the slowest 1%.
High tail latency can cause:
PHP worker exhaustion
Queue growth
Timeouts
User-visible delays
Measure Latency by Endpoint
A provider may have:
/accounts /customers /orders /products
with very different performance.
Monitor latency by endpoint or operation where useful.
Measure Latency by Provider
If the plugin supports multiple providers:
Provider A Provider B Provider C
store provider-level metrics separately.
Measure Latency by Tenant
For SaaS systems, one tenant may have:
High API Latency
because of:
Large datasets
Provider account limits
Specific API endpoints
Do not assume every tenant has the same behavior.
4. Monitor Request Volume
Track:
Requests / Minute Requests / Hour Requests / Day
This helps detect unexpected traffic growth.
Unexpected Request Spikes
Suppose normal traffic is:
100 requests / hour
and suddenly becomes:
10,000 requests / hour
Possible causes include:
Retry loop
Webhook storm
Synchronization bug
Queue duplication
Infinite pagination
Plugin regression
Request-volume monitoring can reveal problems before the provider blocks the integration.
Request Volume by Operation
Track separately:
Customer Fetch Order Update Product Sync Health Check Webhook Fetch Reconciliation
This makes anomalies easier to identify.
5. Monitor Rate Limits
When providers expose quota headers or rate-limit APIs, collect:
Remaining Limit Reset Time
Rate-Limit Health
For example:
Remaining = 85% → Healthy Remaining = 20% → Warning Remaining = 3% → Critical
The exact thresholds should reflect the provider's limits and traffic patterns.
Shared Rate Limits
In a multi-tenant system:
Tenant A Requests Tenant B Requests Tenant C Requests ↓ Shared Provider Quota
Monitor the total provider usage.
Monitoring each tenant individually is not enough.
Rate Limit Exhaustion
If the provider quota is exhausted:
API ↓ 429 ↓ Queue Grows
A monitoring system should connect these symptoms.
6. Monitor Authentication
Track authentication states:
Connected Token Refreshing Refresh Failed Reauthorization Required Disconnected
Do not monitor by recording the token itself.
Monitor Token Refresh Failures
Useful metrics include:
Refresh Attempts Refresh Success Refresh Failure Invalid Grant Reauthorization Required
Authentication Failure Spike
Suppose:
Normal: 2 refresh failures / day Suddenly: 200 refresh failures / hour
Possible causes include:
Provider credential policy change
Client configuration issue
Provider outage
Secret rotation problem
Token invalidation
This deserves investigation.
7. Monitor Webhook Delivery
For webhook integrations, track:
Webhooks Received Webhooks Verified Invalid Signatures Duplicates Queued Processed Failed
Webhook Last-Seen
Store:
last_webhook_received_at
and compare it against expected event activity.
Webhook Delivery Rate
A provider normally delivering:
500 events / day
but suddenly sending:
0 events
may indicate an issue.
However, zero events can be legitimate when there is no business activity.
Health logic should understand expected traffic.
Webhook Processing Latency
Measure:
Webhook Received ↓ Queued ↓ Processed
Track:
Receive → Queue Queue → Process Total Event Latency
8. Monitor Synchronization
Track:
Last Successful Sync Sync Duration Records Processed Records Failed Checkpoint Age
Synchronization Lag
A useful metric is:
Current Time - Last Successful Checkpoint
For example:
Expected: < 5 minutes Current: 45 minutes
The integration is likely degraded.
Monitor Checkpoint Advancement
A healthy incremental synchronization should move forward.
If:
Checkpoint → unchanged for 2 hours
while the provider has active changes, investigate.
Sync Error Rate
Track:
Total Records Failed Records Failure Percentage
A synchronization that completes but fails 30% of records is not healthy.
9. Monitor Queues
For background integrations, track:
Queue Depth Oldest Job Processing Rate Failed Jobs Dead-Letter Jobs
Queue Depth
Queue depth tells you how much work is waiting.
But:
Queue = 500
is not automatically a failure.
You also need:
Oldest Job Age Processing Rate
Oldest Job Age
If the oldest job is:
2 hours old
while normal processing takes:
2 minutes
the queue is likely degraded.
Queue Throughput
Measure:
Jobs Processed / Minute
Then compare:
Incoming Rate vs Processing Rate
If incoming work consistently exceeds processing capacity, the backlog will grow.
10. Monitor Data Freshness
A system can report:
API = Healthy Queue = Healthy
while local data is stale.
Data freshness monitoring connects technical health to business outcomes.
Example Freshness Metric
If remote data was updated at:
10:00
and local data was updated at:
10:08
the lag is:
8 minutes
Freshness Thresholds
Different integrations need different expectations.
For example:
Payments: < 1 minute CRM: < 15 minutes Analytics: < 1 hour
These are examples only.
Set thresholds based on business requirements.
11. Monitor Provider Status
Some providers publish:
Status Page Incident API Service Health
Where available, integrate that information as one monitoring signal.
Do Not Trust Provider Status Alone
A provider can report:
All Systems Operational
while your credentials are invalid.
Always combine:
Provider Status + Real Integration Metrics
Detecting Provider-Wide Incidents
If many tenants simultaneously experience:
503 Latency Spike 429
the system may infer a provider-level issue.
This can prevent unnecessary per-tenant troubleshooting.
12. Monitor Database Dependencies
External integrations often depend on local database writes.
Monitor:
Database Errors Slow Queries Failed Writes Connection Problems
External Service Healthy, Local Database Broken
For example:
CRM API = Healthy Database = Failed
The integration is still broken.
Monitoring must include both sides of the dependency.
13. Monitor Background Worker Health
A queue may contain:
100 jobs
but no worker may be processing them.
Track:
Worker Heartbeat Last Successful Job Last Failed Job Active Worker Count
Heartbeat vs Actual Processing
A worker heartbeat only proves that the process is alive.
A stronger signal is:
Heartbeat + Successful Job + Queue Progress
14. Monitor Cron Health
If synchronization depends on WordPress cron:
WP-Cron ↓ Sync Job
monitor:
Last Cron Run Next Scheduled Run Missed Jobs
Cron Stalling
If expected synchronization is every 10 minutes but:
Last Cron Run = 2 hours ago
that is a serious signal.
15. Monitor Error Trends
A single failure is usually not enough to declare an outage.
A trend is more useful:
1 error → Normal 50 errors → Warning 500 errors → Incident
Thresholds depend on request volume.
Absolute Count vs Rate
For high-volume providers:
100 errors
may be small.
For low-volume providers:
10 errors / 10 requests
is severe.
Use both:
Error Count + Error Rate
Error Classification
Monitoring becomes more valuable when errors are classified:
network authentication authorization rate_limit provider validation database timeout unknown
16. Monitor Timeouts
Timeouts can indicate:
Provider latency
Network issues
DNS problems
Local resource exhaustion
Overly aggressive timeout settings
Track:
Timeout Count Timeout Rate Endpoint Provider
Timeout Trend
Suppose:
Normal: 0.1% Current: 8%
The integration is likely degraded even if most requests still succeed.
17. Monitor SSL/TLS Failures
TLS errors can suddenly break external API communication.
Track:
Certificate Errors TLS Handshake Failures Certificate Validation Failures
Do not solve TLS errors by disabling certificate verification.
18. Monitor DNS Failures
If the provider's hostname cannot be resolved:
DNS Failure ↓ API Unreachable
Classify this separately from provider HTTP errors.
19. Monitor Response Validation Failures
A provider can return:
200 OK
with an unexpected response.
Track:
Schema Validation Errors Malformed JSON Missing Required Fields
This can indicate:
Provider API changes
Proxy problems
Unexpected content
Integration bugs
20. Monitor API Version Changes
If the provider offers version information, monitor:
API Version Deprecation Date Response Version
A provider API upgrade can break integrations even when connectivity remains healthy.
External Service Monitoring Architecture
A mature monitoring pipeline can be:
External Provider │ ┌────────────┼────────────┐ ▼ ▼ ▼ API Webhook Status │ │ │ └────────────┼────────────┘ ▼ Metrics │ ┌────────────────┼────────────────┐ ▼ ▼ ▼ Latency Errors Volume │ │ │ └────────────────┼────────────────┘ ▼ Health Evaluator │ ┌──────────┴──────────┐ ▼ ▼ Alerts Dashboard
Monitoring vs Logging
These are different.
Logs
Record individual events:
Request failed Status = 503
Metrics
Aggregate behavior:
503 Rate = 8%
Monitoring
Determines whether:
Integration = Degraded
A production system often needs all three.
Metrics to Collect
Useful metrics include:
Requests Successful Requests Failed Requests Latency Timeouts 429s 401s 5xx Webhook Events Sync Lag Queue Depth Dead Letters Token Refresh Failures
High-Cardinality Labels
Metrics should be designed carefully.
Using:
Customer Email Request ID Full URL
as high-volume metric labels can create excessive cardinality.
Prefer controlled labels such as:
provider endpoint operation status_class tenant_tier
when appropriate.
Do Not Put Secrets in Metrics
Never use:
API Token Refresh Token Client Secret Webhook Secret
as metric values or labels.
Monitoring by Provider
If ThemeKaddora supports several external services:
CRM ERP AI Payments Analytics
group metrics by provider.
Monitoring by Operation
Track:
customer_sync order_sync product_sync payment_update ai_job
This helps identify specific failing workflows.
Monitoring by Tenant
For multi-tenant SaaS:
Tenant A Tenant B Tenant C
tenant-level metrics can be useful.
But avoid creating excessive metric cardinality for very large tenant counts.
Use aggregate tenant metrics and detailed logs or traces for individual troubleshooting where appropriate.
Alerting Strategy
Do not alert on every error.
Use:
Threshold + Duration + Impact
For example:
503 > 20% for 5 minutes
can be more meaningful than:
One 503
Alert Severity
Possible levels:
Info Warning Critical
Example:
Warning: Latency Above Normal Critical: Authentication Failed Critical: Sync Stalled > Threshold
Alert Deduplication
Avoid flooding administrators:
1000 identical 503 alerts
Use one incident:
Provider API Degraded
and update its status.
Recovery Alerts
When service returns to normal:
Degraded ↓ Healthy
send a recovery notification where useful.
Incident Lifecycle
A monitoring system can track:
Detected ↓ Investigating ↓ Mitigated ↓ Recovered ↓ Resolved
This is especially useful for large SaaS systems.
External Service Monitoring and Webhooks
For webhooks, track:
received verified queued processed failed
This allows you to distinguish:
No Webhook Received
from:
Webhook Received But Not Processed
External Service Monitoring and API Sync
For synchronization, track:
checkpoint last_success records_processed records_failed queue_age
External Service Monitoring and Token Refresh
Track:
refresh_success refresh_failure reauthorization_required
not the actual tokens.
External Service Monitoring and Rate Limiting
Track:
requests_remaining 429_rate retry_after
where the provider exposes them.
External Service Monitoring and Queues
Track:
queue_depth oldest_job_age processing_rate dead_letter_count
External Service Monitoring and Reconciliation
Track:
last_reconciliation differences_found differences_repaired remaining_conflicts
This gives visibility into consistency.
External Service Monitoring and Data Freshness
Track:
remote_update_time local_update_time synchronization_lag
when these values are meaningful.
Monitoring a Payment Provider
A practical monitoring model could include:
API Availability Authentication Payment API Latency Webhook Delivery Webhook Verification Payment Sync Lag 429 Rate 5xx Rate
Monitoring a CRM Provider
Monitor:
API Latency Authentication Customer Sync Webhook Delivery Queue Depth Records Failed Data Freshness
Monitoring an ERP Provider
For ERP systems:
Order Sync Inventory Sync API Availability Rate Limits Queue Age Data Drift
are particularly important.
Monitoring an AI Provider
For AI integrations, monitor:
API Availability Request Latency Provider Errors Rate Limits Token / Usage Consumption Job Completion Webhook Delivery
Monitoring an Analytics Provider
Analytics monitoring may focus on:
Event Delivery API Availability Request Volume Batch Processing Cursor Progress Data Lag
Monitoring a SaaS Provider
For multi-tenant SaaS:
Provider Availability Tenant Connections Authentication Webhook Health Sync Lag Queue Depth Error Rate
Provider Usage Monitoring
Some external services expose usage data.
For example:
Requests Storage Compute AI Tokens Messages Events
Monitoring usage helps detect:
Unexpected growth
Misconfigured loops
Cost spikes
Abuse
Cost Monitoring
If the provider charges per:
Request Token Record Message Compute
track usage alongside system metrics.
A sudden increase in cost may indicate an integration bug.
Detecting Retry Loops Through Usage
Suppose:
API Calls Normal = 1,000 / day Current = 100,000 / day
Possible cause:
Retry Loop
Usage monitoring can therefore serve as an indirect reliability signal.
Monitoring External Dependency Chains
An integration may depend on:
Provider API ↓ OAuth ↓ Webhook ↓ Queue ↓ Database
A provider API failure and a database failure can produce similar symptoms from the business layer.
Dependency-specific metrics make diagnosis easier.
Service Dependency Graph
A monitoring system can model:
ThemeKaddora CRM Integration ├── OAuth ├── CRM API ├── Webhook ├── Queue └── Database
Then determine which dependency is currently unhealthy.
Correlation IDs
A single operation can flow through:
Webhook ↓ Queue ↓ API ↓ Database
Use a correlation ID to link these events.
For example:
integration_event_id
or:
operation_id
Tracing
For complex systems, distributed tracing can show:
Webhook Receive → Queue → CRM API → Database
and identify which stage consumed the most time.
Tracing is especially useful for SaaS products with multiple services.
Monitoring PHP Request Time
External requests can keep PHP workers occupied.
Track:
External API Latency + Total PHP Request Duration
A slow provider can indirectly reduce WordPress capacity.
Monitoring Worker Saturation
Track:
Workers Available Workers Busy Queue Waiting
This helps distinguish:
Provider Slow
from:
WordPress Worker Capacity Too Low
Monitoring Database Impact
External API synchronization may create:
Large Number of Writes
Monitor:
Query time
Write volume
Lock contention
Failed writes
Avoid Monitoring That Creates More Load
A monitoring system should not become the problem.
Avoid:
Full API Export Every Minute
Use:
Lightweight Health Requests + Existing Operational Metrics
Monitoring Frequency
A practical model:
Local Metrics → Continuous Queue Metrics → Frequent Deep API Check → Periodic Full Reconciliation → Scheduled Manual Diagnostic → On Demand
External Monitoring vs Internal Monitoring
External synthetic monitoring can check:
Webhook Endpoint Reachability
while internal monitoring checks:
Webhook Verification Queue Processing
Both can provide different signals.
Synthetic Monitoring
A synthetic test can make a safe request to a service.
For example:
WordPress Monitoring ↓ Provider Health Endpoint ↓ Expected Response
Use only documented, low-cost, non-destructive endpoints.
Do Not Use Real Business Operations as Synthetic Tests
Avoid:
Create Payment Create Order Send Customer Message
unless the provider has a dedicated sandbox/test mode.
External Service Monitoring Storage
For historical metrics, use a structure appropriate to the scale.
For example:
health_check_id provider connection_id metric value timestamp
For high-volume metrics, a dedicated metrics platform may be more appropriate than storing every observation in WordPress tables.
WordPress Database for Monitoring
WordPress database tables can store:
Health snapshots
Incident states
Last-check information
Integration status
Avoid turning the WordPress database into a high-volume raw telemetry warehouse.
Retention Policy
Define how long to keep:
Health snapshots Logs Metrics Incidents
Long-term high-frequency metrics can consume substantial storage.
Monitoring and Privacy
Operational data may accidentally contain:
Customer IDs Email Addresses External Account IDs
Minimize sensitive information in telemetry.
Monitoring and Secrets
Never store:
Access Tokens Refresh Tokens Client Secrets API Keys Webhook Secrets
as ordinary monitoring data.
Monitoring Access Control
Detailed integration monitoring can reveal infrastructure information.
Limit sensitive dashboards to authorized administrators.
Metrics Collector
Responsible for:
Collect Normalize Store Aggregate
Health Evaluator
Responsible for:
Healthy Warning Degraded Failed
based on integration-specific rules.
Alert Manager
Responsible for:
Thresholds State Changes Notifications Deduplication Recovery Alerts
Incident Tracker
Responsible for:
Detected Active Recovered Resolved
and associated history.
Usage Monitor
Responsible for:
Requests Tokens Records Quota Cost
where provider data is available.
Health Snapshot Interface
A reusable interface might be:
interface KDR_Monitoring_Collector { public function collect( string $connection_id ): array; }
The result could contain:
availability latency errors rate_limit webhook sync queue
without secrets.
Example API Metric Collection
$start = microtime( true ); $response = wp_remote_get( $health_url, array( 'timeout' => 8, 'headers' => array( 'Authorization' => 'Bearer ' . $token, 'Accept' => 'application/json', ), ) ); $duration_ms = (int) round( ( microtime( true ) - $start ) * 1000 );
Store the result as telemetry, not the token.
Example Metric Record
Conceptually:
$metric = array( 'provider' => 'crm', 'connection_id'=> $connection_id, 'operation' => 'account_health', 'status_code' => $status_code, 'latency_ms' => $duration_ms, 'checked_at' => gmdate( 'c' ), );
Keep sensitive headers and credentials out of the record.
Alert Evaluation
For example:
if ( $error_rate > 0.20 && $window_minutes >= 5 ) { kdr_open_incident( 'crm-api-degraded' ); }
The threshold should be configured for the actual integration.
Do Not Hardcode Universal Thresholds
Different providers have different:
Baseline latency
Error rates
Rate limits
Business criticality
Use integration-specific policies.
External Service Monitoring Checklist
☑ API Availability ☑ API Latency ☑ HTTP Error Rates ☑ Timeout Rate ☑ Authentication Failures ☑ Rate Limits ☑ Request Volume ☑ Webhook Delivery ☑ Webhook Processing ☑ Sync Lag ☑ Queue Depth ☑ Oldest Queue Job ☑ Worker Health ☑ Data Freshness ☑ Provider Status ☑ Usage / Cost ☑ Incident State
Common External-Service Monitoring Mistakes
Monitoring Only Uptime
A service can be reachable but functionally broken.
Monitoring Only HTTP 200
A successful status may still contain invalid or unusable data.
No Latency Monitoring
Slow dependencies can exhaust WordPress resources.
No Rate-Limit Monitoring
The integration can suddenly receive repeated 429 errors.
No Sync Monitoring
Data can become stale while APIs remain healthy.
No Webhook Monitoring
Events can silently stop arriving.
No Queue Monitoring
Background jobs can accumulate unnoticed.
No Usage Monitoring
A retry loop can generate unexpected provider costs.
No Tenant Monitoring
One customer's problem can be hidden inside aggregate metrics.
Excessive Health Requests
Monitoring can itself consume API quota.
Logging Credentials
Telemetry can become a credential-leak vector.
No Alert Deduplication
Administrators receive thousands of identical alerts.
Best Practices for WordPress External Service Monitoring
A professional monitoring system should:
Monitor availability and latency separately.
Track HTTP status classes and important individual error codes.
Measure request rates and detect abnormal spikes.
Monitor provider rate limits.
Track OAuth refresh failures without storing tokens.
Monitor webhook receipt and processing independently.
Track synchronization checkpoints and data freshness.
Monitor queue depth, oldest-job age, and worker progress.
Distinguish provider-wide incidents from tenant-specific failures.
Record structured metrics instead of dumping complete requests.
Keep secrets and personal data out of logs and metrics.
Use thresholds based on actual provider behavior.
Alert on sustained or meaningful state changes.
Cache expensive health checks where appropriate.
Use shared rate limiting for monitoring requests.
Track usage and cost where provider information is available.
Maintain historical incident and recovery information.
Provide actionable diagnostics for administrators.
Test monitoring itself with controlled failure scenarios.
Why choose ThemeKaddora?
ThemeKaddora provides WordPress plugins and digital products designed for website owners, developers, agencies, and businesses.
Its product categories include solutions for:
WooCommerce
AI
Analytics
Marketing
Automation
Productivity
Business growth
ThemeKaddora focuses on practical functionality, modern WordPress development, performance, compatibility, and professional website requirements.
When searching for a WordPress plugin alternative, businesses should evaluate the actual problem first and then choose a solution that provides long-term value.
Conclusion
External service monitoring is essential for modern WordPress integrations because the website itself can remain online while its dependencies are failing.
A WordPress site can still return:
200 OK
while:
CRM API = Failing Webhook = Delayed Queue = Stalled Sync = Stale
Therefore, monitoring must measure the complete integration path.
The first major principle is availability plus functionality.
Do not rely only on:
Provider is reachable
Check whether the provider is actually responding to the operations the integration requires.
The second principle is latency.
A provider can be technically available while becoming slow enough to cause:
PHP Worker Exhaustion Queue Growth Timeouts User Delays
Track percentiles such as P95 and P99 when your monitoring system supports them.
The third principle is error trends.
One 503 may be normal.
A sustained:
503 Rate = 30%
is a very different signal.
Monitor:
Error Count + Error Rate + Duration
rather than isolated failures alone.
The fourth principle is rate-limit awareness.
Track:
429 Requests Remaining Retry-After Usage
and coordinate limits across:
Webhooks Sync Reconciliation Health Checks
A health monitor that ignores provider quotas can accidentally make the integration less reliable.
The fifth principle is synchronization monitoring.
An API can be healthy while:
Checkpoint → Stopped Advancing
Track:
Last Successful Sync Checkpoint Age Queue Age Records Failed
to detect stale data.
The sixth principle is webhook monitoring.
Measure:
Received Verified Queued Processed Failed
because:
API Healthy
does not prove:
Webhook Healthy
The seventh principle is worker and queue monitoring.
A queue depth of:
500
does not necessarily indicate a problem.
Also monitor:
Oldest Job Age Processing Rate Last Successful Job Dead Letters
to understand whether the system is progressing.
The eighth principle is usage and cost monitoring.
Unexpected API volume can reveal:
Retry Loop Duplicate Queue Jobs Synchronization Bug Webhook Storm
For AI and other usage-based services, this can also prevent unexpected costs.
The ninth principle is provider-wide incident detection.
If many tenants simultaneously experience:
503 Latency Spike 429
the issue may be at the provider rather than individual WordPress installations.
The tenth principle is actionable observability.
A monitoring dashboard should not merely say:
FAILED
It should explain:
What failed? Why? How many tenants are affected? When did it start? What can be done?
For example:
CRM API: DEGRADED 503 responses: 31% for 8 minutes Affected connections: 214 Sync backlog: 2,840 jobs Action: Automatic backoff active
This is far more useful.
For ThemeKaddora products, a reusable monitoring framework can be:
External Providers / | \ API Webhooks Status \ | / \ | / ▼ ▼ ▼ Metrics │ ┌────────────┼─────────────┐ ▼ ▼ ▼ Errors Latency Usage │ │ │ └────────────┼─────────────┘ ▼ Health Evaluator │ ┌───────┴────────┐ ▼ ▼ Dashboard Alerts
This architecture can support:
CRM
ERP
WooCommerce
AI
SaaS
Analytics
Payments
Marketing
Inventory
The most important principle is:
Monitor the dependency in the context of the business workflow, not simply whether its server responds.
A professional WordPress external-service monitoring system should be:
Continuous
→ Component-Aware
→ Latency-Aware
→ Rate-Limit-Aware
→ Usage-Aware
→ Tenant-Aware
→ Secure
→ Actionable
→ Historical
→ Recovery-Aware
When these principles are followed, integration problems can be detected earlier, diagnosed more accurately, and managed before they become large data-synchronization failures or customer-facing incidents.
Frequently Asked Questions
What is external service monitoring in WordPress?
It is the process of monitoring APIs, webhooks, authentication, synchronization, queues, rate limits, latency, errors, and other dependencies that WordPress integrations rely on.
Is checking API uptime enough?
No. An API can be reachable while authentication, webhooks, synchronization, or specific business operations are failing.
What API metrics should I monitor?
Monitor availability, latency, HTTP errors, timeout rate, request volume, rate limits, and important operation-specific failures.
Why should I monitor API latency?
Increasing latency can cause PHP requests, queues, and synchronization processes to slow down even when the API remains technically available.
Should I monitor 401 and 429 separately?
Yes. 401 often indicates authentication or authorization problems, while 429 indicates rate limiting. They require different recovery actions.
How can I detect a provider outage?
Look for correlated increases in errors, latency, or timeouts across many connections and compare those signals with provider status information when available.
How do I monitor webhook health?
Track webhook receipt, signature verification, queueing, processing latency, failures, and the time since the last expected event.
How do I monitor synchronization health?
Track the last successful checkpoint, sync duration, records processed, failures, queue age, and data freshness.
Should monitoring requests count against API limits?
Usually yes. Treat monitoring traffic as part of the provider's API usage and coordinate it with synchronization and other API workloads.
Why choose Themekaddora?
Themekaddora provides lightweight, responsive, SEO-friendly WordPress themes with fast performance, WooCommerce compatibility, flexible customization, accessibility-conscious design, modern templates, regular updates, and professional support—providing a strong foundation for businesses building digital products and product-focused websites.
Comments (0)