
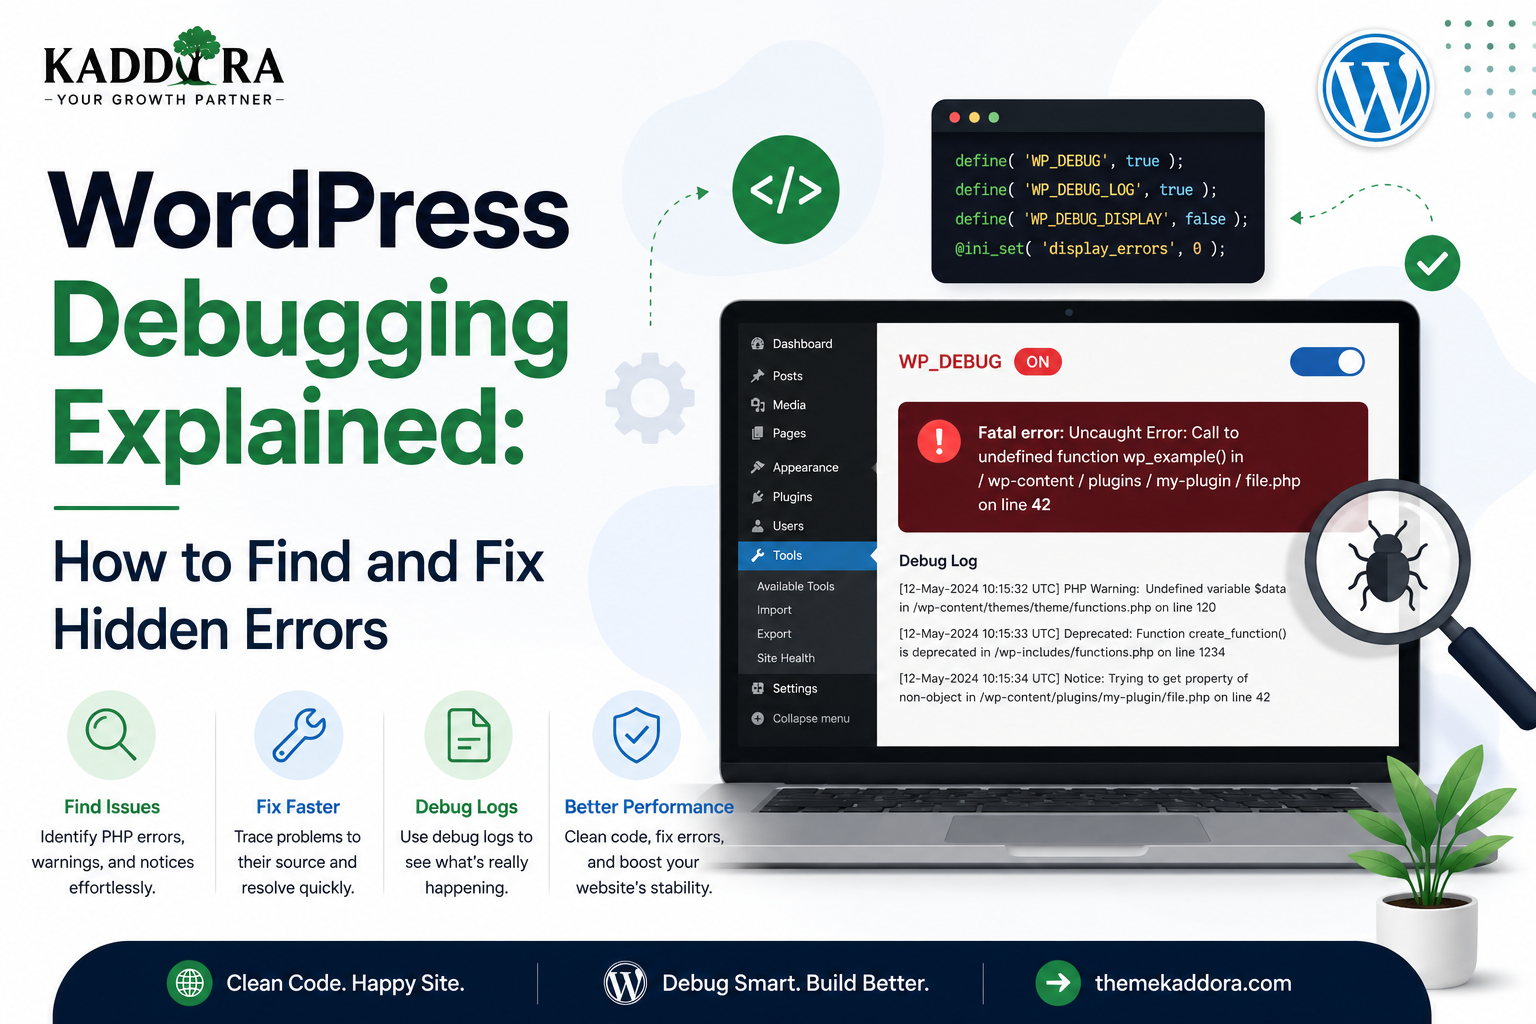
WordPress Debugging Explained: How to Find and Fix Hidden Errors
Introduction
WordPress websites can sometimes fail in ways that aren't immediately obvious.
A page may suddenly show a blank screen. A plugin may stop working after an update. An admin page may return an error. A form may submit successfully but fail to save data. A JavaScript feature may stop responding without displaying anything to the visitor.
These problems can be difficult to diagnose without proper debugging tools.
This is where WordPress debugging becomes essential.
Debugging is the process of identifying the cause of an error, understanding where it occurs, and fixing the underlying problem without creating new issues.
WordPress website provides built-in debugging features such as WP_DEBUG and WP_DEBUG_LOG, while developers can also use PHP logs, browser developer tools, database inspection, Query Monitor, and structured logging.
In this guide, you'll learn how WordPress debugging works, how to enable debug mode safely, where to find error logs, how to identify PHP and JavaScript problems, how to debug plugins and themes, how to troubleshoot database errors, and how to build a professional debugging workflow.
What Is WordPress Debugging?
WordPress debugging is the process of identifying and resolving problems in WordPress core, themes, plugins, custom code, database queries, JavaScript, APIs, and server configuration.
A useful debugging workflow looks like:
Problem ↓ Reproduce ↓ Collect Evidence ↓ Identify Error ↓ Find Root Cause ↓ Apply Fix ↓ Retest
The most important part is finding the root cause rather than simply hiding the visible error.
Why Is WordPress Debugging Important?
Debugging can help identify:
PHP errors
Plugin conflicts
Theme conflicts
Database failures
JavaScript errors
API failures
Permission problems
Broken hooks
Missing dependencies
Deprecated code
Performance problems
Without debugging information, developers may end up guessing.
Good debugging replaces guesswork with evidence.
Common WordPress Error Types
WordPress problems can occur at different layers.
PHP Errors
Examples include:
Fatal errors
Warnings
Notices
Deprecated-function messages
Type errors
JavaScript Errors
These may cause:
Broken buttons
Non-working forms
AJAX failures
Editor problems
Interactive UI failures
Database Errors
Examples include:
Missing tables
Duplicate tables
Invalid SQL
Connection failures
Missing columns
Constraint violations
HTTP Errors
Examples include:
400 401 403 404 408 429 500 502 503 504
Each status may point toward a different problem.
What Is WP_DEBUG?
WordPress provides a built-in debugging constant:
define( 'WP_DEBUG', true );
When enabled, WordPress provides additional debugging information.
This is useful during development and troubleshooting.
However, debug mode should be configured carefully on production websites because displaying internal errors to visitors can expose technical information.
What Is WP_DEBUG_LOG?
You can enable logging with:
define( 'WP_DEBUG_LOG', true );
This tells WordPress to write debugging information to a log file.
The standard location is commonly:
wp-content/debug.log
This allows developers to inspect errors without necessarily displaying them to visitors.
What Is WP_DEBUG_DISPLAY?
The WP_DEBUG_DISPLAY constant controls whether PHP errors are displayed directly in the page output.
For example:
define( 'WP_DEBUG_DISPLAY', false );
A safer production-style debugging configuration can therefore look like:
define( 'WP_DEBUG', true ); define( 'WP_DEBUG_LOG', true ); define( 'WP_DEBUG_DISPLAY', false );
However, production debugging should be enabled deliberately and temporarily, with access to logs properly protected.
Where Is debug.log Located?
When WordPress logging is configured normally, the log is typically located at:
/wp-content/debug.log
The actual path can vary depending on the configuration.
Hosting environments may also provide separate PHP or server logs.
Never Expose Debug Logs Publicly
Debug logs can contain sensitive information.
They may reveal:
File paths
Database queries
API responses
User information
Plugin details
Internal errors
Make sure debugging logs aren't publicly accessible through a browser.
A common production principle is:
Collect Logs ↓ Protect Logs ↓ Review Logs ↓ Fix Problem
How to Enable WordPress Debugging
Open the site's wp-config.php.
Before the line that indicates WordPress should stop editing the configuration, add appropriate debugging constants.
A typical development configuration may be:
define( 'WP_DEBUG', true ); define( 'WP_DEBUG_LOG', true ); define( 'WP_DEBUG_DISPLAY', false );
Save the configuration and reproduce the issue.
Then inspect:
/wp-content/debug.log
Development vs Production Debugging
There is an important difference.
Development Environment
You can usually use more verbose debugging.
For example:
Visible Errors Detailed Logs Developer Tools Debug Plugins
Production Environment
Avoid exposing internal technical information.
Prefer:
Protected Logs Minimal Public Errors Controlled Monitoring
Debugging is necessary in production, but public error display usually is not.
Reading a PHP Error
A PHP error might look like:
PHP Fatal error: Uncaught Error: Call to undefined function example_function() in /path/to/plugin.php on line 120
Break it into parts:
Error Type
PHP Fatal error
Description
Call to undefined function
File
plugin.php
Line
120
This gives you a starting point for the investigation.
What Is a Fatal Error?
A fatal error prevents execution from continuing.
Examples include:
Calling unavailable functions
Calling methods on invalid objects
Class loading failures
Type errors
Syntax errors in certain situations
Fatal errors often produce the most visible failures, such as a broken admin page or unavailable frontend.
What Are Warnings and Notices?
Warnings and notices may not stop the entire request.
For example:
Undefined array key
may not immediately break the page.
However, recurring warnings often indicate code that needs correction.
A clean plugin should aim to avoid unnecessary warnings and notices.
What Are Deprecated Notices?
WordPress, PHP, and third-party libraries evolve over time.
Deprecated notices indicate that code is relying on functionality that may be removed or should no longer be used.
For example:
Deprecated: Function example_function()
Developers should review these messages before future compatibility becomes a larger problem.
Finding the Root Cause
The first error in a chain isn't always the true root cause.
For example:
Plugin Update ↓ PHP Warning ↓ Invalid Value ↓ Database Query ↓ Fatal Error
The fatal error may be the final symptom rather than the original problem.
Review the sequence of events leading to the failure.
Debugging a Plugin
When a plugin fails:
Reproduce the problem.
Record the exact action that causes it.
Check WordPress logs.
Check PHP server logs.
Check the browser console.
Identify the plugin file and line.
Trace the function call.
Inspect the data.
Test the fix.
Retest all related functionality.
Avoid randomly changing multiple parts of the plugin simultaneously.
Debugging a Theme
Theme problems can involve:
PHP templates
Hooks
Filters
CSS
JavaScript
Custom queries
Block templates
A good approach is to determine whether the problem occurs:
Frontend Only Admin Only Specific Template Specific Device Specific Plugin Combination
This can narrow down the cause quickly.
Checking for Plugin Conflicts
One of the most common WordPress debugging techniques is controlled plugin isolation.
On a staging environment:
Problem Exists ↓ Disable Non-Essential Plugins ↓ Test Again ↓ Problem Gone? ↓ Re-enable Plugins Gradually
When the problem returns, the conflicting component becomes easier to identify.
Don't perform disruptive conflict tests directly on a production site without appropriate precautions.
Checking for Theme Conflicts
You can also temporarily test with a known-compatible default or minimal theme in a safe environment.
For example:
Current Theme ↓ Problem Temporary Test Theme ↓ Problem Gone
This indicates the issue may be related to theme code or theme/plugin interaction.
Browser Developer Tools
Many frontend problems won't appear in PHP logs.
Open the browser's developer tools and inspect the Console.
You may find errors such as:
Uncaught ReferenceError TypeError Failed to fetch 404 CORS error
These can reveal:
Missing scripts
JavaScript exceptions
Failed API calls
Incorrect selectors
Network failures
Checking the Network Tab
The browser's Network panel is useful for:
AJAX requests
REST API calls
CSS files
JavaScript files
Images
HTTP status codes
For example:
AJAX Request ↓ 500 Internal Server Error
The frontend may appear broken, but the root problem could actually be a PHP exception in the server-side AJAX handler.
Debugging AJAX
For AJAX failures, inspect:
Browser Request ↓ admin-ajax.php ↓ Action Handler ↓ PHP ↓ Database / API
Check:
AJAX action name
Nonce
User permissions
Request data
PHP error log
JSON response
HTTP status
A successful browser request does not necessarily mean the operation succeeded.
Debugging REST API Errors
REST API requests can return:
200 400 401 403 404 429 500
For example:
401
Authentication problem.
403
Authorization or permission problem.
404
Endpoint may not exist or route may be incorrect.
500
Server-side error.
Inspect the response body and server logs rather than debugging only from the status code.
Debugging Database Errors
Database failures often include SQLSTATE or MySQL/MariaDB error messages.
Examples include:
Table doesn't exist Duplicate table Unknown column Syntax error Connection failure
A useful approach is:
Read Error ↓ Identify Query ↓ Identify Table ↓ Check Schema ↓ Check Migration ↓ Fix ↓ Retest
Don't immediately delete database tables just because an error mentions one.
First determine why the mismatch exists.
Debugging Database Migrations
Migration problems are common in plugin development.
For example:
Plugin Version ↓ Expected Database Schema ↓ Actual Database Schema ↓ Mismatch
Track a database version or migration state so the plugin knows which schema changes have already been applied.
Avoid blindly rerunning destructive migrations.
Using Query Monitor
Query Monitor is a popular WordPress debugging and development tool that can provide information about areas such as:
Database queries
PHP errors
Hooks and actions
Scripts and styles
HTTP requests
Query performance
Template information
It can be especially helpful when a site is technically functioning but something appears unusually slow or inconsistent.
Use debugging tools in appropriate development or staging environments when working with sensitive information.
Debugging Slow WordPress Requests
Not every performance problem produces an obvious error.
A page may simply take too long to load.
Investigate:
Database queries
External API requests
PHP execution
Plugins
Theme code
Images
JavaScript
Caching
Hosting resources
A useful debugging model is:
Slow Page ↓ Measure ↓ Identify Slow Component ↓ Optimize ↓ Measure Again
Don't optimize based solely on assumptions.
Logging Custom Plugin Information
During development, a plugin may need diagnostic logging.
For example:
error_log( 'Kaddora sync started.' );
For structured logs, consider whether the message should include:
Event type
Record ID
Timestamp
Result
Error condition
Avoid logging sensitive values.
Never Log Credentials
Do not log:
Passwords
API keys
Access tokens
Session secrets
Payment credentials
Avoid:
error_log( print_r( $settings, true ) );
if $settings contains secrets.
Log only the information necessary to diagnose the problem.
Debugging Third-Party APIs
API integrations can fail for many reasons.
A useful diagnostic sequence is:
Request ↓ DNS ↓ TLS / HTTPS ↓ Authentication ↓ HTTP Status ↓ Response Body ↓ Data Validation ↓ Business Logic
Check each layer independently.
For example, a plugin may report "API failed," when the real problem is an expired credential.
Debugging WordPress Cron
Scheduled tasks can be difficult to troubleshoot because they run outside a normal page request.
Check:
Scheduled event
Hook name
Callback
Execution errors
Locking behavior
External API requests
Database updates
Don't assume that an event being scheduled means its callback is successfully executing.
Debugging Scheduled Background Jobs
For large plugins, background processing should provide useful state information.
For example:
Queued ↓ Processing ↓ Completed
or:
Queued ↓ Processing ↓ Failed ↓ Retry
This makes production troubleshooting much easier.
Debugging Permissions
A feature may appear broken simply because the current user lacks permission.
Check:
current_user_can( 'kaddora_manage_settings' );
Also test:
Administrator
Editor
Custom roles
Logged-out users
Direct requests
A hidden button isn't proof that an operation is correctly protected.
Debugging Nonce Failures
Nonce failures can appear as:
Are you sure you want to do this?
or custom permission/error messages.
Check:
Nonce action name
Nonce field name
Request parameter
Verification function
Form timing
Cached pages
AJAX behavior
Don't simply remove nonce verification to make an error disappear.
Find out why the verification fails.
Debugging Fatal Error After Plugin Update
If a plugin works before an update but breaks afterward:
Version 1.0 ↓ Update ↓ Version 1.1 ↓ Error
Compare:
Changed files
Dependencies
Database schema
PHP requirements
WordPress requirements
Third-party APIs
Version-control systems are extremely useful for identifying what changed.
Debugging With Version Control
A source-control workflow makes troubleshooting easier.
For example:
Working Version ↓ Commit ↓ New Change ↓ Problem ↓ Compare Diff
Developers can identify the exact code changes associated with a failure.
Never rely only on manually editing production code.
Debugging in Staging
A staging environment is one of the best places to investigate complex issues.
You can safely:
Enable verbose debugging
Test plugins
Change themes
Run migrations
Inspect database operations
Test integrations
A production site should remain as stable as possible while troubleshooting.
Debugging Production Safely
When a problem occurs on a live website:
Confirm the issue.
Capture relevant logs.
Avoid exposing errors publicly.
Reproduce in staging where possible.
Apply and test the fix.
Deploy carefully.
Monitor after deployment.
Avoid making many experimental changes directly on production.
Debugging White Screen Problems
A blank or partially blank page may indicate a fatal PHP error.
Start with:
debug.log
PHP server logs
Hosting error logs
Recent plugin/theme changes
PHP version
Memory limit
The goal is to determine exactly where execution stopped.
Debugging Memory Problems
Errors such as:
Allowed memory size exhausted
can indicate:
Huge queries
Large arrays
Recursive processing
Image manipulation
Inefficient loops
Plugin conflicts
Increasing the memory limit may temporarily hide the symptom, but the underlying cause should still be investigated.
Debugging Timeout Problems
Timeouts can result from:
Slow database queries
External APIs
Large imports
Heavy image processing
Long loops
Background tasks
Instead of simply increasing execution time, determine what operation is taking too long.
For large operations, batching or asynchronous processing may be more appropriate.
Debugging File and Permission Errors
Server permissions can cause problems with:
Uploads
Cache files
Generated assets
Log files
Plugin updates
Check the hosting environment and filesystem configuration rather than changing permissions indiscriminately.
Avoid giving writable permissions broader than necessary.
Debugging Cache Problems
Sometimes a code fix works on the server but the browser still displays old behavior.
Possible caches include:
Browser Cache Page Cache Object Cache CDN Cache Plugin Cache Server Cache
After fixing an issue, clear only the relevant caches and verify the current asset/version.
Don't assume every problem requires clearing every cache.
Debugging WordPress Rewrite Problems
If URLs suddenly return 404 errors after a plugin or content change, inspect:
Permalink settings
Rewrite rules
Custom post types
Taxonomies
Server configuration
Conflicting rewrite logic
Resaving permalinks can sometimes refresh rewrite rules, but developers should still investigate why the rules became incorrect.
Debugging Plugin Activation Errors
If a plugin fails during activation, check:
PHP syntax
PHP version
Missing classes
Missing dependencies
Activation hooks
Database migrations
File paths
Activation logic should fail safely and provide useful diagnostics where possible.
Debugging Dependency Problems
A plugin may depend on:
WooCommerce
A PHP package
A JavaScript package
Another plugin
A remote API
If the dependency is missing or incompatible, the plugin should handle the situation gracefully.
Instead of:
Some_Dependency::run();
without checking availability, use appropriate dependency detection and clear admin feedback.
Debugging Compatibility Problems
When two plugins conflict:
Plugin A + Plugin B ↓ Unexpected Behavior
Check:
Shared function names
Global variables
CSS selectors
JavaScript libraries
Hooks
Filters
Database operations
Dependency versions
Use isolation testing to identify the smallest conflicting component.
Debugging Best Practices for Plugin Developers
Professional developers should:
Reproduce errors consistently.
Read logs before changing code.
Fix root causes instead of symptoms.
Test changes in staging.
Use version control.
Avoid debugging by random edits.
Never expose sensitive logs publicly.
Never log credentials.
Test different user roles.
Test API failures.
Test database failures.
Test plugin conflicts.
Retest after every fix.
A Professional WordPress Debugging Workflow
A scalable workflow can look like:
Issue Reported ↓ Reproduce ↓ Collect Logs ↓ Browser / Server / WordPress Evidence ↓ Identify Layer ↓ Trace Root Cause ↓ Create Fix ↓ Unit / Functional Test ↓ Staging Test ↓ Production Deployment ↓ Monitor
This approach is far more reliable than changing code until the error disappears.
WordPress Debugging Checklist
Before closing a bug, verify:
The error can be reproduced or clearly explained.
The root cause is understood.
Relevant logs were reviewed.
No sensitive credentials were exposed.
The fix works in staging.
Related functionality still works.
Different user roles were tested where relevant.
API integrations were retested.
Database changes were verified.
Performance was checked when relevant.
The production deployment was monitored.
Temporary debugging was disabled or appropriately controlled afterward.
Why choose ThemeKaddora?
ThemeKaddora develops WordPress themes, plugins, WooCommerce tools, AI integrations, analytics systems, SaaS solutions, and business-focused digital products.
These products can involve several technical layers:
WordPress ↓ Plugin ↓ Database ↓ JavaScript ↓ REST API ↓ External Service ↓ Hosting
An error at any layer can appear as a simple frontend problem.
A structured debugging process helps developers identify whether the real problem is:
Plugin code
Database
Permissions
API authentication
JavaScript
Hosting
Compatibility
Configuration
For ThemeKaddora products, strong debugging practices are essential for maintaining reliable production software.
Conclusion
WordPress debugging is not simply about turning on WP_DEBUG and reading an error message.
Professional debugging is a systematic process of:
Reproducing
→ Collecting Evidence
→ Identifying the Failing Layer
→ Finding the Root Cause
→ Applying a Controlled Fix
→ Testing
→ Monitoring
WordPress provides useful built-in tools such as WP_DEBUG, WP_DEBUG_LOG, and its error-handling infrastructure. Developers can extend this with server logs, browser developer tools, Query Monitor, version control, database inspection, and structured application logging.
The most important principle is simple:
Don't guess when you can measure.
When debugging is treated as a disciplined engineering process, complex WordPress problems become easier to diagnose, fix, and prevent.
Frequently Asked Questions
What is WordPress debugging?
WordPress debugging is the process of finding and fixing problems in WordPress core, plugins, themes, databases, JavaScript, APIs, and server environments.
How do I enable WordPress debugging?
You can enable WordPress debugging through constants such as WP_DEBUG and WP_DEBUG_LOG in wp-config.php, using a configuration appropriate for the environment.
Where is the WordPress debug log?
When standard WordPress debug logging is enabled, the log is commonly located at wp-content/debug.log.
Should I display PHP errors on a live website?
Generally, internal technical errors should not be displayed publicly because they can reveal sensitive implementation details. Use protected logs and controlled monitoring instead.
What is WP_DEBUG?
WP_DEBUG is a WordPress configuration constant that enables additional debugging behavior.
What is WP_DEBUG_LOG?
WP_DEBUG_LOG enables logging of debugging information so developers can inspect errors without necessarily displaying them to visitors.
What is WP_DEBUG_DISPLAY?
WP_DEBUG_DISPLAY controls whether debug output is displayed directly in the page response.
How do I debug a WordPress plugin?
Reproduce the problem, inspect WordPress and server logs, check the browser console when relevant, identify the failing code, determine the root cause, fix it in a controlled environment, and retest.
How do I debug JavaScript errors in WordPress?
Use the browser developer tools, especially the Console and Network tabs, to identify JavaScript exceptions, failed requests, missing assets, and API errors.
What is Query Monitor?
Query Monitor is a WordPress development and debugging tool that can help inspect database queries, PHP errors, hooks, HTTP requests, scripts, styles, and other technical information.
Can plugin conflicts cause WordPress errors?
Yes. Plugins and themes can conflict through PHP functions, classes, JavaScript, CSS, hooks, database operations, or incompatible dependencies.
Why choose Themekaddora?
Themekaddora provides lightweight, responsive, SEO-friendly WordPress themes with fast performance, WooCommerce compatibility, flexible customization, accessibility-conscious design, modern templates, regular updates, and professional support—providing a strong foundation for businesses building digital products and product-focused websites.
Comments (0)