
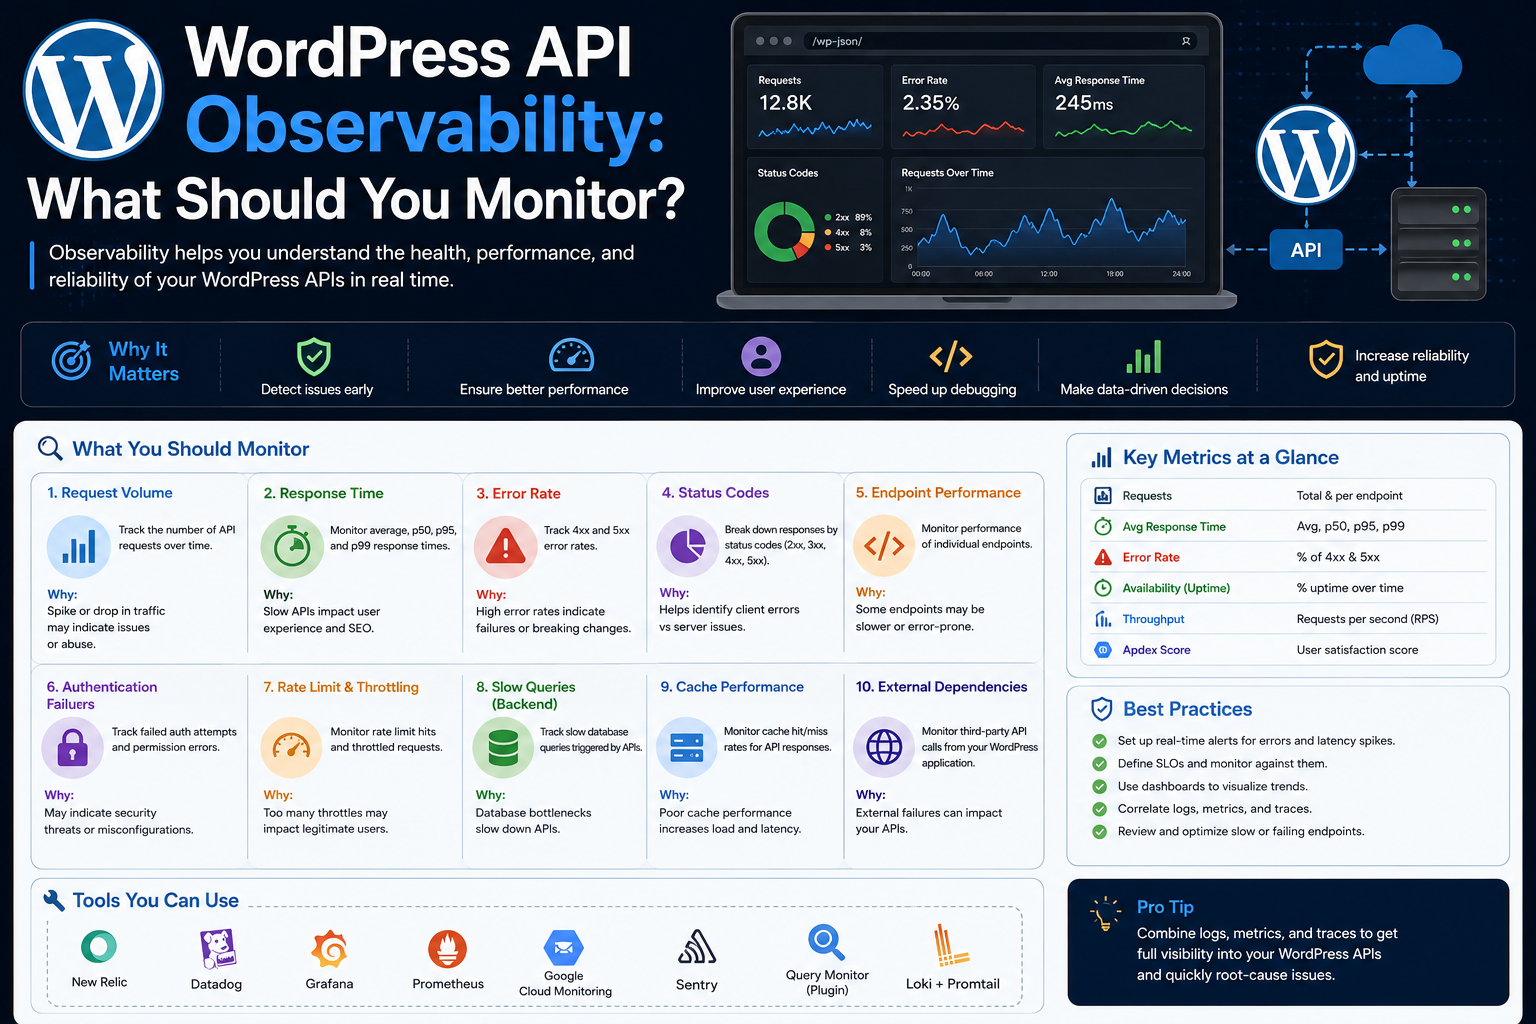
WordPress API Observability: What Developers Should Monitor
Introduction
Modern WordPress plugins often depend on external APIs for:
CRM
Payments
AI
Analytics
Shipping
SaaS
Marketing
Business automation
When everything works, an integration may appear simple:
WordPress ↓ API Client ↓ External Service ↓ Response
But when something goes wrong, a basic error log may not provide enough information.
Consider this:
API request failed.
That message does not tell you:
Which provider failed?
Which operation failed?
How long did the request take?
Was it a timeout?
Was it a 401, 429, or 503?
How many requests are failing?
Is one tenant affected?
Is the whole provider unavailable?
Is the queue growing?
Is synchronization falling behind?
Did the request eventually recover?
This is where API observability becomes important.
Observability is the ability to understand the internal state and behavior of a system by examining the information it produces.
For WordPress API integrations, this generally involves three major signals:
Metrics Logs Traces
These can be combined with integration-specific state such as:
Queue Synchronization Webhooks Credentials Rate Limits Provider Health
A useful architecture is:
WordPress Integration │ ┌──────┼───────┐ ▼ ▼ ▼ Metrics Logs Traces │ │ │ └───────┼───────┘ ▼ Observability │ ┌────┴────┐ ▼ ▼ Dashboard Alerts
The key principle is:
Do not monitor only whether an API request failed; monitor enough context to understand why it failed, how much it affected the system, and whether the integration recovered.
What Is API Observability?
API observability means collecting and analyzing operational information about API communication and the workflows that depend on it.
A useful model includes:
Request Response Latency Errors Retries Rate Limits Authentication Queue Synchronization
This helps answer:
What happened, why did it happen, and what is affected?
Observability vs Monitoring
These terms are related.
Monitoring
Monitoring usually answers:
Is the system healthy?
For example:
API Error Rate > 10%
Observability
Observability goes further:
Why is the error rate high?
For example:
Provider = CRM Operation = order_sync Status = 503 P95 Latency = 4.2 sec Affected Connections = 84
Monitoring detects the problem.
Observability helps explain it.
The Three Core Observability Signals
Metrics
Numerical measurements over time.
Examples:
Requests Errors Latency 429 Rate Queue Depth
Logs
Detailed individual events.
Examples:
Request failed Credential refresh failed Webhook processed
Traces
A view of one operation across multiple components.
For example:
Webhook ↓ Queue ↓ API Request ↓ Database
A mature integration can use all three.
1. Monitor Request Volume
Track:
Requests / Minute Requests / Hour Requests / Day
Unexpected growth can indicate:
Retry loops
Duplicate jobs
Polling problems
Webhook storms
Synchronization bugs
For example:
Normal: 1,000 requests/hour Current: 20,000 requests/hour
is worth investigating.
2. Monitor Success Rate
A basic health metric is:
Successful Requests ÷ Total Requests
Track the success rate over time.
A sudden drop can indicate:
Provider outage
Credential failure
API change
Network problem
Application regression
3. Monitor Error Rate
Track both:
Error Count Error Percentage
For example:
Requests: 10,000 Errors: 100 Error Rate: 1%
An absolute count without request volume can be misleading.
4. Classify Errors
Do not group every failure together.
Useful categories include:
authentication authorization validation rate_limit timeout network provider database unknown
This makes alerts and recovery logic more useful.
5. Track HTTP Status Codes
Important statuses include:
401 403 404 409 422 429 500 502 503 504
Track them individually when the distinction is useful.
A sudden increase in:
429
means something different from:
503
6. Monitor Latency
Track API response time:
Request Start ↓ Provider ↓ Response ↓ Latency
Useful measurements include:
Average P50 P95 P99
Why Percentiles Matter
Average latency can hide slow requests.
For example:
99 requests → 200 ms 1 request → 30 sec
The average may not fully communicate the impact of the slow request.
P95 and P99 reveal tail latency.
7. Monitor Timeouts
Track:
Timeout Count Timeout Rate
A provider can remain technically reachable while becoming increasingly slow.
For example:
Timeout Rate: 0.1% → 1% → 8%
This can indicate an emerging problem.
8. Monitor Retries
Track:
Retry Count Retry Rate Retry Reason Attempts Per Operation
A sudden retry increase often indicates:
Provider degradation
Network instability
Rate limits
Application regression
9. Track Retry Exhaustion
Monitor operations that exceed their retry limit.
For example:
Retry Attempts: 3 Final State: Dead Letter
A growing dead-letter queue requires attention.
10. Monitor Rate Limits
If the provider exposes quota information, collect:
Limit Remaining Reset Retry-After
Track:
429 Count 429 Rate
A rate-limited system is not necessarily unavailable, but it is operating under traffic pressure.
11. Monitor Authentication Health
Track:
Authentication Success Authentication Failure Token Refresh Success Token Refresh Failure Reauthorization Required
Do not record the actual credentials.
12. Monitor Credential Expiration
If OAuth tokens expose expiration:
expires_at
track upcoming expiration.
For example:
Credentials: Healthy Expires: Soon
The exact warning period depends on provider behavior.
13. Monitor Webhooks
For webhook-based integrations, track:
Received Verified Queued Processed Failed Duplicate
Also track:
Last Webhook Received
when event frequency makes that useful.
14. Monitor Webhook Processing Latency
Measure:
Webhook Received ↓ Queued ↓ Processed
Track:
Receive → Queue Queue → Process Total Processing Time
This helps identify bottlenecks.
15. Monitor Webhook Failures
Useful metrics include:
Invalid Signature Malformed Payload Processing Failure API Follow-Up Failure Queue Failure
These provide much more context than a single webhook error count.
16. Monitor Queue Depth
Background integrations often depend on queues.
Track:
Queue Depth
But queue size alone is not enough.
A queue of:
500 jobs
may be healthy if workers are processing quickly.
17. Monitor Oldest Job Age
Track:
Age of Oldest Pending Job
For example:
Normal: 30 seconds Current: 45 minutes
This indicates processing is falling behind.
18. Monitor Queue Throughput
Track:
Jobs Added / Minute Jobs Completed / Minute
If:
Incoming Rate > Processing Rate
the backlog will continue growing.
19. Monitor Failed Jobs
Track:
Failed Jobs Retrying Jobs Dead-Letter Jobs
Break them down by operation where possible.
20. Monitor Synchronization Lag
A key integration metric is:
Current Time - Last Successful Synchronization
For example:
Expected: < 10 minutes Actual: 90 minutes
The integration is degraded even if individual API requests are occasionally successful.
21. Monitor Checkpoint Progress
A healthy synchronization process should advance its checkpoint.
Track:
Last Checkpoint Last Checkpoint Time Current Cursor
If the checkpoint remains unchanged while new data exists, investigate.
22. Monitor Records Processed
For synchronization:
Records Fetched Records Processed Records Failed Records Skipped
These metrics help identify partial failures.
23. Monitor Data Freshness
For systems where freshness matters:
Remote Updated At Local Updated At
can produce:
Synchronization Lag
This is often more meaningful to users than raw API uptime.
24. Monitor Provider Health
If a provider publishes a status API or status page, use it as one signal.
Combine:
Provider Status + Actual API Metrics
Do not rely exclusively on either.
25. Detect Provider-Wide Incidents
If many connections experience:
503 Timeout High Latency
at the same time, the issue may be provider-wide.
Observability should correlate these events.
26. Monitor by Provider
For multiple providers:
CRM A → 1% errors CRM B → 18% errors CRM C → 0.4% errors
This immediately highlights the problematic dependency.
27. Monitor by Operation
Track operations such as:
customer_sync order_sync product_sync payment_update health_check webhook_fetch
An API may be healthy overall while one endpoint is failing.
28. Monitor by Tenant
For multi-tenant SaaS:
Tenant A → Healthy Tenant B → Degraded Tenant C → Healthy
This allows operations teams to distinguish:
Connection Problem
from:
Provider-Wide Problem
29. Avoid Excessive Metric Cardinality
Metrics should use controlled dimensions such as:
provider operation status_class environment
Avoid using high-cardinality fields such as:
email request body full URL unique request ID
as metric labels.
30. Use Structured Logs
Instead of:
API failed
use structured fields:
provider=crm operation=order_sync status=503 attempt=2 latency_ms=2400
This makes searching and aggregation easier.
31. Never Log Credentials
Do not log:
API Key Access Token Refresh Token Client Secret Webhook Secret Authorization Header
Observability must not become a credential-leak mechanism.
32. Be Careful With API Responses
External responses may contain personal or confidential information.
Avoid storing full payloads unless necessary.
Prefer safe fields such as:
HTTP Status Error Code Provider Request ID Latency
33. Use Correlation IDs
One operation can move through several components:
Webhook ↓ Queue ↓ Service ↓ API ↓ Database
Use a correlation ID to connect those events:
operation_id = sync_12345
This makes debugging significantly easier.
34. Request IDs
Many providers return request identifiers.
Store them when safe:
Provider Request ID: req_abc123
This can be extremely useful when contacting provider support.
35. Distributed Tracing
For complex systems, tracing can show:
Webhook 20 ms ↓ Queue 10 ms ↓ API 850 ms ↓ Database 40 ms
This identifies where time is actually being spent.
36. Trace the Complete Operation
A useful trace may include:
Operation Started ↓ Credential Lookup ↓ API Request ↓ Response Parsing ↓ Database Write ↓ Checkpoint Commit
This is more useful than separate disconnected logs.
37. Do Not Put Secrets Into Trace Attributes
Tracing systems can be widely accessible.
Never add:
Authorization API Token Customer Password
to trace metadata.
38. Monitor Circuit Breakers
If the integration uses circuit breakers, monitor:
Open Count Close Count Half-Open Probes Probe Failures Open Duration
A constantly opening circuit is a strong reliability signal.
39. Monitor Rate Limiter State
Useful metrics:
Requests Throttled Quota Remaining Rate-Limit Events Wait Time
This shows whether the integration is operating within provider limits.
40. Monitor API Usage and Cost
For usage-based services, monitor:
Requests Tokens Records Messages Credits
Unexpected growth may reveal:
Retry loops
Duplicate jobs
Application bugs
Misconfigured polling
Unexpected user activity
41. Monitor Database Impact
External API synchronization can create substantial local database activity.
Track:
Write Volume Slow Queries Failed Writes Transaction Failures
An external API can be healthy while the local database becomes the bottleneck.
42. Monitor Worker Health
For background workers:
Active Workers Worker Heartbeat Last Successful Job Failed Jobs
A queue can appear healthy while workers are actually stalled.
43. Monitor Cron Health
If synchronization uses WP-Cron:
Last Cron Run Expected Next Run Missed Runs
A stale cron schedule can look like an API problem when the actual problem is local scheduling.
44. Monitor Environment
Always distinguish:
development staging sandbox production
A sandbox outage should not trigger a production incident.
45. Monitor Connection State
A connection may be:
healthy degraded reauthorization_required rate_limited provider_unavailable disconnected
This gives administrators a useful operational view.
46. Build an Integration Health Score Carefully
A dashboard might summarize:
API: Healthy Authentication: Healthy Webhook: Healthy Sync: Delayed Queue: Warning
Avoid reducing complex health into one number unless the scoring model is meaningful.
47. Use Dashboards for Different Audiences
Developer Dashboard
Show:
Status Codes Latency Request IDs Error Categories
Administrator Dashboard
Show:
Connection Status Sync Queue Last Success Next Retry
Avoid overwhelming non-technical users with raw infrastructure information.
48. Alert on Symptoms, Not Every Event
Do not alert:
One 503
Instead alert:
503 Rate > Threshold for 5 minutes
This reduces alert fatigue.
49. Use Severity Levels
For example:
Info Warning Critical
Example:
Warning: Latency Increasing Critical: Provider Unavailable Critical: Synchronization Stalled
50. Deduplicate Alerts
A provider outage should produce one incident:
CRM API Degraded
rather than hundreds of separate messages.
51. Send Recovery Alerts
When the dependency returns:
Degraded ↓ Healthy
record or notify recovery when appropriate.
This gives operations teams a complete incident lifecycle.
52. Track Time to Recovery
Useful incident metrics include:
Time to Detect Time to Mitigate Time to Recover
This helps evaluate integration reliability.
53. Monitor Error Budgets
For critical integrations, define acceptable availability or error targets.
For example:
Target: 99.9% successful requests
The exact target depends on the business and provider.
54. Track SLOs
Service-level objectives can include:
API Success Rate Synchronization Freshness Webhook Processing Time Queue Delay
This moves monitoring from individual errors toward measurable reliability.
55. Monitor Business Outcomes
Technical metrics are useful, but business metrics can reveal deeper problems.
For example:
Orders Successfully Synced Payments Reconciled Customers Updated Inventory Freshness
A provider can be technically reachable while business synchronization remains broken.
56. Use Business and Technical Signals Together
For example:
API: Healthy Queue: Healthy Orders Synced: 0
This combination indicates a workflow problem that ordinary API uptime monitoring might miss.
57. Monitor Unknown Operations
Important external writes can enter:
unknown
after timeouts.
Track the count and age of unknown operations.
A growing unknown-operation queue may indicate a serious reconciliation problem.
58. Monitor Conflicts
Track:
Conflicts Detected Conflicts Resolved Conflicts Pending
Conflict counts can indicate synchronization design problems or concurrent changes.
59. Monitor Stale Connections
A connection may remain configured while no successful API activity has occurred for a long period.
Track:
Last Successful Request Last Successful Sync Last Credential Validation
60. Monitor Credential Refresh
Track:
Refresh Attempts Refresh Successes Refresh Failures Reauthorization Required
Never monitor by storing token values.
61. Monitor API Version
For providers with versioned APIs:
API Version Deprecation Date
can be useful operational metadata.
62. Monitor Provider Changes
Integration health may degrade after:
API version changes
Endpoint removals
Scope changes
Authentication changes
Schema changes
Observability data helps identify when the behavior changed.
63. Monitor Response Validation Failures
Track cases where:
HTTP 200
is returned but:
Response Schema Invalid
This can reveal provider changes or proxy problems.
64. Monitor Data Mapping Failures
A provider response can be valid while the plugin cannot map it.
Track:
Records Mapping Failed Fields Missing Unsupported Statuses
65. Monitor Queue and API Together
A useful dashboard combines:
API Error Rate + Queue Depth + Oldest Job Age
For example:
503 Rate = 15% Queue = 8,000 Oldest Job = 2 hours
This indicates a significant integration incident.
66. Monitor API and Database Together
Similarly:
API = Healthy Database = Slow Queue = Growing
could indicate local infrastructure problems rather than provider issues.
67. Correlate Across Layers
A complete diagnostic might show:
Provider Latency ↑ ↓ Timeouts ↑ ↓ Retries ↑ ↓ Queue Depth ↑ ↓ Sync Lag ↑
This is much more valuable than separate alerts.
68. Observability Data Retention
Define retention periods for:
Metrics
Logs
Traces
Incident history
Avoid storing high-frequency data forever.
69. Protect Privacy
Observability data can accidentally contain:
Emails
Names
Customer IDs
Account IDs
Order information
Minimize sensitive data and apply appropriate access controls.
70. Secure Observability Access
Operational dashboards can reveal:
Provider architecture
Integration status
Tenant information
Error patterns
Restrict access to authorized administrators and developers.
71. API Observability in WordPress
For smaller plugins, basic observability can use:
WordPress Logs + Metrics Table + Admin Dashboard
Larger SaaS systems may benefit from dedicated telemetry infrastructure.
72. Do Not Turn WordPress Into a Telemetry Warehouse
Storing every HTTP request forever inside wp_options is not a good design.
High-volume telemetry may require:
Dedicated tables
External metrics systems
Log aggregation
Time-series infrastructure
The architecture should match the scale.
73. Use Structured Operational Records
For example:
provider connection_id operation status latency_ms attempt environment timestamp
Keep the record small and useful.
74. Avoid High-Volume Autoloaded Monitoring Data
Do not store large monitoring payloads in data that WordPress loads automatically on normal requests.
This can create unnecessary application overhead.
75. Test Observability
Do not assume monitoring works.
Simulate:
503 429 Timeout Queue Stalled Webhook Failure Credential Failure Recovery
and verify that:
Metrics update
Logs are generated
Alerts trigger
Incidents close
Sensitive information remains protected
76. Test Alert Deduplication
Generate repeated failures:
503 503 503 503
Verify one incident is maintained rather than generating four independent alerts.
77. Test Recovery Detection
Simulate:
503 503 200
Verify that the system records:
Incident Opened ↓ Incident Recovered
78. Test Multi-Tenant Observability
Verify that Tenant A's data does not appear in Tenant B's administrative view.
Tenant-level observability must respect tenant isolation.
79. Test Environment Isolation
Verify:
Sandbox Failure
does not create:
Production Incident
80. Test Credential Redaction
Use a fake secret in an API request and verify that:
Logs Metrics Traces Alerts
do not contain it.
Example Observability Record
A safe record might contain:
$metric = array( 'provider' => 'crm', 'operation' => 'customer_sync', 'status_code' => 503, 'error_category'=> 'provider', 'latency_ms' => 2400, 'attempt' => 2, 'environment' => 'production', );
It does not need to contain credentials or full response bodies.
Example Correlation Context
A request can carry:
operation_id connection_id trace_id
through:
Webhook ↓ Queue ↓ Service ↓ API Client ↓ Database
This makes cross-layer debugging easier.
Best Practices for WordPress API Observability
A professional observability strategy should:
Monitor request volume and success rate.
Track HTTP error classes and important status codes.
Measure latency percentiles.
Track timeout and retry rates.
Monitor rate limits and quota usage.
Track authentication and token-refresh failures.
Monitor webhook delivery and processing.
Track queue depth, throughput, and oldest-job age.
Measure synchronization lag and checkpoint progress.
Track data freshness and business outcomes.
Correlate provider, operation, tenant, and environment.
Use structured logs with safe metadata.
Use correlation IDs for multi-step operations.
Use traces for complex workflows.
Avoid sensitive data in logs, metrics, and traces.
Deduplicate alerts and track recovery.
Monitor circuit breakers and rate limiters.
Retain operational data according to actual needs.
Test monitoring and alerting with controlled failures.
Common Observability Mistakes
Monitoring Only Uptime
The API can be available while synchronization is broken.
Logging Everything
This can expose sensitive data and create storage problems.
No Correlation IDs
Individual events become difficult to connect.
Only Monitoring Average Latency
Tail latency can remain hidden.
No Queue Metrics
Background failures stay invisible.
No Business Metrics
Technical health may look good while business operations fail.
No Tenant Isolation
Sensitive operational information can leak across accounts.
No Recovery Alerts
Teams know when something broke but not when it recovered.
High-Cardinality Metrics
Unique IDs can make telemetry systems expensive and difficult to query.
Monitoring Without Testing
A dashboard is useless if the signals are incorrect.
Why choose ThemeKaddora?
ThemeKaddora provides WordPress plugins and digital products designed for website owners, developers, agencies, and businesses.
Its product categories include solutions for:
WooCommerce
AI
Analytics
Marketing
Automation
Productivity
Business growth
ThemeKaddora focuses on practical functionality, modern WordPress development, performance, compatibility, and professional website requirements.
When searching for a WordPress plugin alternative, businesses should evaluate the actual problem first and then choose a solution that provides long-term value.
Conclusion
WordPress API observability is about understanding the behavior of external integrations, not simply collecting error messages.
A basic log might say:
API request failed.
A useful observability system can say:
Provider: CRM Operation: order_sync Status: 503 P95 Latency: 2.8 sec Retry Rate: 18% Queue: 1,284 jobs Oldest Job: 31 min Affected Connections: 48 Incident: Provider Degraded
This level of context makes troubleshooting significantly easier.
The first principle is monitor more than uptime.
Track:
API Queue Synchronization Webhooks Credentials Business Outcomes
The second principle is use the three observability signals:
Metrics Logs Traces
Metrics show trends.
Logs explain events.
Traces connect one operation across multiple components.
The third principle is measure latency correctly.
Use:
P50 P95 P99
where useful.
The fourth principle is classify errors.
A:
401
is different from:
429
and:
503
Each requires a different interpretation.
The fifth principle is monitor queues and synchronization.
A healthy API does not necessarily mean a healthy integration.
The sixth principle is track business outcomes.
For example:
API = Healthy
while:
Orders Synced = 0
indicates a workflow problem.
The seventh principle is correlate events.
Use:
operation_id connection_id trace_id
to connect logs, metrics, API requests, and queue jobs.
The eighth principle is protect sensitive information.
Never put API keys, tokens, secrets, passwords, or unnecessary personal data into telemetry.
The ninth principle is design observability for multi-tenant systems.
Provider-level issues and tenant-level issues should be distinguishable without leaking tenant information.
The tenth principle is monitor recovery.
A complete incident lifecycle is:
Detected ↓ Investigating ↓ Mitigated ↓ Recovered ↓ Resolved
For ThemeKaddora products, the recommended observability architecture is:
WordPress Integration │ ┌──────────────────┼──────────────────┐ ▼ ▼ ▼ Metrics Logs Traces │ │ │ └──────────────────┼──────────────────┘ ▼ Health Evaluator │ ┌──────────────┼───────────────┐ ▼ ▼ ▼ Dashboard Alerts Incidents
This can support:
CRM
ERP
Payments
AI
WooCommerce
Analytics
SaaS
Marketing
The most important principle is:
Good observability should let developers move from "something failed" to "this exact operation failed for this reason, affected these connections, created this backlog, and recovered at this time."
A professional WordPress API observability system should be:
Actionable
→ Structured
→ Correlated
→ Secure
→ Multi-Tenant-Aware
→ Business-Aware
→ Latency-Aware
→ Recovery-Aware
→ Tested
→ Scalable
When these principles are followed, API failures become measurable and diagnosable events rather than mysterious problems discovered only after customers report them.
Frequently Asked Questions
What is API observability in WordPress?
It is the practice of collecting metrics, logs, traces, and integration-health information so developers can understand how external APIs and dependent workflows are behaving.
What is the difference between monitoring and observability?
Monitoring tells you that a system may be unhealthy. Observability provides the detailed context needed to investigate why it is unhealthy.
What API metrics should I monitor?
Monitor request volume, success rate, error rate, latency, timeouts, retries, rate limits, authentication failures, and operation-specific performance.
Should I monitor API latency averages?
Do not rely only on averages. P95 and P99 can reveal slow requests that averages hide.
What should I monitor besides the API?
Monitor queues, webhooks, synchronization lag, checkpoints, data freshness, workers, credentials, circuit breakers, and important business outcomes.
Should API responses be stored in logs?
Usually not in full. Store only the information necessary for diagnosis and avoid credentials and unnecessary personal or confidential data.
What is a correlation ID?
It is a safe identifier that connects events belonging to the same logical operation across services, queues, API calls, and database actions.
Why choose Themekaddora?
Themekaddora provides lightweight, responsive, SEO-friendly WordPress themes with fast performance, WooCommerce compatibility, flexible customization, accessibility-conscious design, modern templates, regular updates, and professional support—providing a strong foundation for businesses building digital products and product-focused websites.
Comments (0)