
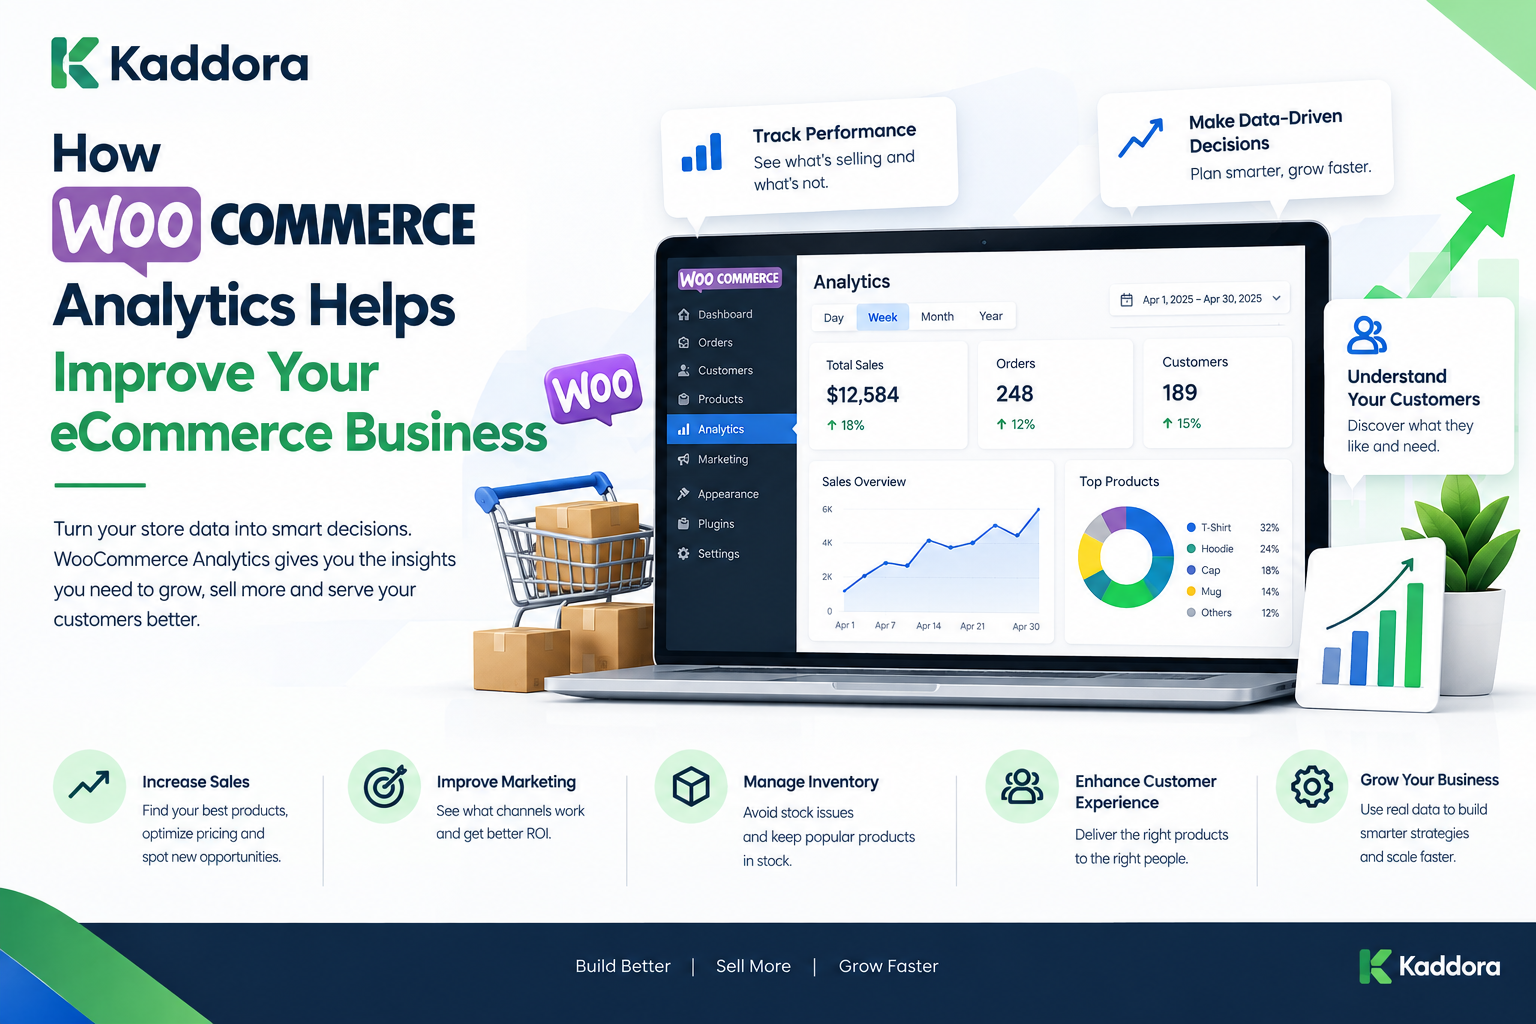
How WooCommerce Analytics Helps Improve Your eCommerce Business
Introduction
Running a WooCommerce store is not only about adding products and receiving orders.
As an online business grows, store owners need to understand what is happening inside the business.
Which products generate the most sales?
Which products are underperforming?
Where does revenue come from?
Which customers purchase repeatedly?
Which marketing campaigns generate orders?
When do customers buy?
Which products have high demand?
Without reliable data, many decisions become based on assumptions.
This is where WooCommerce analytics becomes important.
WooCommerce analytics helps store owners collect, organize, analyze, and interpret eCommerce data so they can better understand store performance.
Instead of looking only at the total number of orders, analytics can provide a broader view of:
Sales
Revenue
Orders
Products
Customers
Categories
Coupons
Taxes
Shipping
Store performance
Customer behavior
In this guide, we will explain what WooCommerce analytics is, which metrics matter, how analytics can improve an eCommerce business, and how to build a more data-driven WooCommerce store.
What Is WooCommerce Analytics?
WooCommerce analytics is the process of analyzing data generated by a WooCommerce store.
This data can include:
Orders Products Customers Revenue Quantity Sold Average Order Value Conversions Refunds Coupons Taxes Shipping
The purpose is not simply to collect numbers.
The real purpose is to turn store data into useful business information.
For example:
Raw Data ↓ Orders Products Customers Revenue ↓ Analytics ↓ Insights ↓ Business Decisions
Analytics can help identify patterns that may not be obvious when looking at individual orders.
Why Is WooCommerce Analytics Important?
An online store generates large amounts of information.
Without analytics, store owners may struggle to answer basic questions such as:
Which products sell the most?
Which products generate the most revenue?
Which customers return?
What is the average order value?
How are sales changing?
Which categories perform well?
Which discounts are being used?
How many orders are refunded?
Which periods generate the most sales?
Analytics turns these questions into measurable reports.
WooCommerce Analytics vs Basic Sales Reports
A sales report may show:
Orders: 250 Revenue: ₹500,000
Analytics can go further:
Top Product Top Category Average Order Value Returning Customer Rate Refund Rate Sales Trend Order Trend Customer Trend
The difference is the depth of analysis.
Basic reports answer:
What happened?
Analytics can help explore:
Why did it happen?
and:
What patterns can we identify?
Important WooCommerce Analytics Metrics
Not every metric is equally useful for every business.
However, several metrics are commonly useful for eCommerce analysis.
1. Total Sales
Total sales provide a basic view of store performance.
For example:
Monthly Sales January → ₹200,000 February → ₹230,000 March → ₹275,000
Looking at sales over time can reveal trends.
2. Net Sales
Gross sales and net sales are not always the same.
Returns, refunds, discounts, and other adjustments can affect the final amount.
For business analysis, it is important to understand which sales figure a report represents.
3. Number of Orders
Order volume shows how many transactions the store receives.
For example:
Week 1 → 120 orders Week 2 → 145 orders Week 3 → 172 orders
Order volume becomes more useful when combined with revenue.
4. Average Order Value
Average Order Value, or AOV, estimates the average amount spent per order.
A simplified calculation is:
AOV = Revenue ÷ Number of Orders
For example:
Revenue = ₹500,000 Orders = 1,000 AOV = ₹500
Tracking AOV can help businesses understand purchasing patterns.
5. Product Sales
Product-level analytics can identify which products generate the most sales.
Example:
Product A → 500 units Product B → 320 units Product C → 180 units
This can help with inventory and merchandising decisions.
6. Product Revenue
The most frequently purchased product is not necessarily the product generating the most revenue.
For example:
Product A Units Sold: 1,000 Price: ₹100 Product B Units Sold: 200 Price: ₹1,000
Product B sells fewer units but generates more revenue.
This is why both quantity and revenue should be considered.
7. Category Performance
Category analytics can reveal which product categories contribute most to the store.
For example:
Electronics → ₹800,000 Accessories → ₹350,000 Office Products → ₹200,000
This can help businesses evaluate their product mix.
8. Customer Analytics
Customer analytics provides information about purchasing behavior.
Useful areas include:
New customers
Returning customers
Orders per customer
Customer revenue
Purchase frequency
9. New vs Returning Customers
A store may have many first-time buyers but relatively few repeat customers.
Analytics can reveal this difference.
New Customers ████████████████ Returning Customers ████████
The appropriate interpretation depends on the business model.
10. Customer Lifetime Value
Customer Lifetime Value, often abbreviated as CLV or LTV, estimates the value generated by a customer over their relationship with a business.
The calculation can vary depending on the business model and available data.
Tracking customer value can help businesses analyze retention and customer acquisition strategies.
11. Refund Analytics
Refunds can affect revenue and customer experience.
Analytics can identify:
Refund volume
Refunded products
Refund amounts
Refund trends
For example:
Product A → 2% refund rate Product B → 8% refund rate Product C → 12% refund rate
A high refund rate may justify further investigation into product quality, descriptions, fulfillment, expectations, or other operational factors.
12. Coupon Analytics
Coupons can influence customer purchasing behavior.
Analyze:
Coupon usage
Discount amount
Orders using coupons
Revenue associated with promotions
A discount may increase order volume while reducing average order value or margins, so both sides should be considered.
13. Sales by Time Period
Compare performance across:
Days
Weeks
Months
Quarters
For example:
Monday → ₹40,000 Tuesday → ₹45,000 Wednesday → ₹52,000 Thursday → ₹47,000 Friday → ₹71,000
This can reveal recurring sales patterns.
14. Seasonal Analytics
Many eCommerce businesses experience seasonal changes.
Analytics can compare:
Normal Period vs Promotion Period vs Holiday Period
Historical data can help businesses plan inventory and marketing activity.
How WooCommerce Analytics Improves Business Decisions
Analytics can improve decision-making by replacing assumptions with measurable information.
Consider this process:
Question ↓ Collect Data ↓ Analyze ↓ Identify Pattern ↓ Test Action ↓ Measure Result
This creates a continuous improvement cycle.
WooCommerce Analytics for Product Decisions
Product analytics can help answer:
Which products are popular?
Which products generate revenue?
Which products have declining sales?
Which products have high refund rates?
Which products are frequently purchased together?
This information can support decisions around:
Inventory
Pricing
Product positioning
Promotions
Merchandising
WooCommerce Analytics for Inventory Planning
Inventory decisions become easier when sales trends are visible.
For example:
Current Stock: 100 Average Weekly Sales: 40 Potential Stock Coverage: ≈ 2.5 weeks
This is a simplified example and does not account for lead times or future demand changes.
More advanced systems can combine historical sales with additional forecasting methods.
WooCommerce Analytics for Customer Retention
Acquiring a customer is only one part of eCommerce growth.
Analytics can help identify:
Repeat purchase patterns
Customer purchase frequency
Average customer value
Customer inactivity
Businesses can then evaluate retention strategies based on actual customer behavior.
WooCommerce Analytics for Marketing
Marketing analytics can connect store performance with campaigns.
For example:
Campaign A Visitors → 10,000 Orders → 250 Revenue → ₹300,000 Campaign B Visitors → 5,000 Orders → 300 Revenue → ₹420,000
Traffic alone does not explain business performance.
The relationship between traffic, orders, revenue, and costs provides more context.
WooCommerce Analytics and Conversion Rate
Conversion rate measures the proportion of visitors who complete a desired action, depending on how it is defined.
A simplified eCommerce conversion calculation is:
Conversion Rate = Orders ÷ Visitors × 100
For example:
Visitors = 10,000 Orders = 200 Conversion Rate = 2%
Store owners can track changes over time to identify patterns.
WooCommerce Analytics and Average Order Value
AOV is particularly useful when evaluating upselling and cross-selling strategies.
For example:
Before Strategy AOV = ₹800 After Strategy AOV = ₹950
This does not by itself prove that a strategy caused the increase, but it provides a metric that can be monitored alongside other evidence.
WooCommerce Analytics for Upselling
Analytics can identify products that are frequently purchased together.
For example:
Laptop + Laptop Bag + Mouse
This information can support product recommendation and upselling strategies.
WooCommerce Analytics for Cross-Selling
Cross-selling involves offering complementary products.
Analytics can reveal purchasing relationships.
For example:
Camera ↓ Memory Card ↓ Camera Bag
These relationships can inform merchandising and recommendation systems.
WooCommerce Analytics for Pricing Decisions
Sales data can help businesses evaluate pricing changes.
For example:
Price A → Sales Volume A Price B → Sales Volume B
However, revenue alone is not enough.
Businesses should also consider:
Costs
Margins
Discounts
Returns
Customer acquisition costs
WooCommerce Analytics for Revenue Analysis
Revenue should be analyzed from multiple perspectives.
For example:
Revenue ├── Product ├── Category ├── Customer ├── Channel ├── Time └── Promotion
This gives businesses a broader understanding of where revenue originates.
WooCommerce Analytics Dashboard
A useful dashboard can provide a high-level overview.
For example:
--------------------------------------- WooCommerce Analytics Dashboard --------------------------------------- Revenue ₹850,000 Orders 1,240 AOV ₹685 Customers 980 Refunds ₹32,000 --------------------------------------- Top Products 1. Product A 2. Product B 3. Product C --------------------------------------- Sales Trend Jan ███████ Feb █████████ Mar ███████████ Apr █████████████ ---------------------------------------
A dashboard should prioritize useful information instead of displaying every available metric.
What Should a WooCommerce Analytics Dashboard Include?
Depending on the business, useful dashboard sections can include:
Sales Overview
Revenue
Orders
AOV
Product Performance
Top products
Product revenue
Units sold
Customer Performance
New customers
Returning customers
Customer value
Order Performance
Completed orders
Pending orders
Cancelled orders
Refunded orders
Marketing
Coupon usage
Campaign performance
Conversion metrics
Real-Time WooCommerce Analytics
Some businesses need near-real-time information.
Examples include:
Current orders
Active sales
Inventory alerts
Payment activity
Real-time dashboards can be useful for operational monitoring, but historical reporting remains important for identifying long-term trends.
WooCommerce Analytics and Business Intelligence
Analytics can become the foundation of broader business intelligence.
A simplified model is:
WooCommerce ↓ Data Collection ↓ Data Processing ↓ Analytics ↓ Business Intelligence ↓ Decision Making
As the business grows, analytics can incorporate information from:
WooCommerce
ERP
CRM
Marketing platforms
Payment systems
Shipping systems
Connecting WooCommerce Analytics With ERP
An ERP can provide additional operational data.
For example:
WooCommerce ↓ Orders ↓ ERP ↓ Inventory + Purchasing + Finance ↓ Analytics
This can provide a broader view than analyzing WooCommerce orders alone.
WooCommerce Analytics and AI
AI can be used to enhance analytics.
Potential applications include:
Automated sales summaries
Anomaly detection
Product recommendations
Customer segmentation
Demand forecasting
Sales trend analysis
Automated reporting
A possible architecture is:
WooCommerce Data ↓ Analytics Layer ↓ AI Analysis ↓ Insights ↓ Business Dashboard
AI-generated insights should still be validated against the underlying data.
Automated WooCommerce Reports
Businesses can automate recurring reports such as:
Daily sales
Weekly sales
Monthly revenue
Product performance
Inventory
Customer activity
Refunds
For example:
Every Monday ↓ Generate Report ↓ Analyze Previous Week ↓ Send to Management
WooCommerce Analytics and Mobile Monitoring
Store owners may need to monitor business performance while away from their desktop.
A responsive analytics dashboard can provide access to key metrics such as:
Revenue
Orders
Sales trends
Inventory alerts
The dashboard should prioritize readability on smaller screens.
Common WooCommerce Analytics Mistakes
1. Tracking Too Many Metrics
More metrics do not automatically mean better decisions.
Focus on metrics connected to actual business goals.
2. Looking Only at Revenue
Revenue without costs, refunds, discounts, and margins can provide an incomplete picture.
3. Ignoring Customer Behavior
Product and sales data should be complemented with customer analysis.
4. Ignoring Refunds
Gross sales can hide the impact of refunds.
5. Not Comparing Time Periods
A single number has limited context.
Compare appropriate periods.
6. Making Decisions From One Metric
Combine multiple data points before drawing conclusions.
7. Ignoring Data Quality
Incorrect tracking produces misleading analytics.
8. Not Acting on Insights
Analytics only becomes valuable when insights inform measurable actions and those actions are evaluated.
How to Set Up WooCommerce Analytics
A practical setup can follow these steps.
Step 1: Define Your Goals
Determine what you want to understand.
Examples:
Increase sales
Improve AOV
Reduce refunds
Improve retention
Optimize products
Step 2: Identify Key Metrics
Choose metrics connected to those goals.
Step 3: Verify Data Collection
Make sure order, product, customer, and other relevant information is recorded correctly.
Step 4: Build Reports
Create dashboards that make the important information easy to understand.
Step 5: Compare Trends
Look at historical performance.
Step 6: Identify Patterns
Find significant changes or recurring behavior.
Step 7: Take Action
Make a controlled business change.
Step 8: Measure Again
Compare the results against the previous period or an appropriate baseline.
WooCommerce Analytics Checklist
Use this checklist when building your analytics strategy:
Track orders
Track revenue
Track net sales
Track AOV
Track products
Track categories
Track customers
Track returning customers
Track refunds
Track coupons
Track sales trends
Track conversion metrics
Track inventory
Create dashboards
Create recurring reports
Validate data
Protect customer information
Review metrics regularly
Advanced WooCommerce Analytics
As a store grows, analytics can become more sophisticated.
Advanced analytics can include:
Cohort Analysis
Compare groups of customers based on when they first purchased.
Customer Segmentation
Group customers based on purchasing behavior.
Product Affinity
Identify products frequently purchased together.
Sales Forecasting
Estimate future demand using historical data and other relevant variables.
Funnel Analysis
Analyze stages such as:
Visitor ↓ Product View ↓ Add to Cart ↓ Checkout ↓ Purchase
Anomaly Detection
Identify unusual changes in:
Orders
Revenue
Refunds
Traffic
Product sales
WooCommerce Analytics for eCommerce Growth
Analytics does not automatically grow a business.
Instead, it provides information that can support better decisions.
The process should be:
Measure ↓ Understand ↓ Act ↓ Test ↓ Measure Again
This creates a repeatable optimization process.
Why Choose Kaddora?
Kaddora focuses on WordPress, WooCommerce, analytics, AI, ERP, automation, plugins, themes, and digital business solutions.
For WooCommerce businesses, analytics can become an important part of understanding store performance.
Kaddora's WordPress and WooCommerce-focused solutions can support areas such as:
Sales analytics
WooCommerce reporting
Business intelligence
ERP workflows
AI-powered insights
Store automation
Product management
Customer analysis
WooCommerce optimization
The goal is to help website owners and businesses understand their data and build more organized digital operations.
Conclusion
WooCommerce analytics provides a way to understand what is happening inside an online store.
Instead of relying only on total sales, store owners can analyze:
Sales + Orders + Products + Customers + Revenue + Refunds + Conversion + Inventory + Marketing
The real value of analytics comes from connecting these metrics with business decisions.
A product report can influence inventory planning.
Customer analytics can inform retention strategies.
Order analytics can reveal purchasing trends.
AOV can help evaluate upselling efforts.
Refund data can identify products that need investigation.
AI and ERP integrations can take analytics further by connecting eCommerce data with broader business operations and automated insights.
The most effective analytics strategy is not necessarily the one with the largest number of reports. It is the one that provides accurate, relevant information that helps the business measure performance, identify opportunities, test improvements, and monitor results.
For WooCommerce stores of different sizes, the right analytics setup will depend on the business model, goals, data volume, and operational complexity.
Frequently Asked Questions
What is WooCommerce Analytics?
WooCommerce Analytics is the process of analyzing data generated by a WooCommerce store, including sales, orders, products, customers, revenue, refunds, and other eCommerce metrics.
Why is WooCommerce Analytics important?
It helps store owners understand store performance and identify patterns that can support data-driven business decisions.
What are the most important WooCommerce metrics?
Common metrics include revenue, orders, average order value, product sales, customer activity, refunds, conversion rate, and inventory performance.
How can WooCommerce Analytics improve sales?
Analytics can identify product trends, customer behavior, purchasing patterns, and sales opportunities. Businesses can then test strategies based on those insights.
What is Average Order Value in WooCommerce?
Average Order Value represents the average amount spent per order and can be calculated by dividing revenue by the number of orders for the relevant period.
Can WooCommerce Analytics help increase Average Order Value?
Analytics can help identify purchasing patterns and provide data for evaluating upselling, cross-selling, bundles, and other strategies that aim to influence order value.
Can AI be used with WooCommerce Analytics?
Yes. AI can be used for applications such as automated summaries, anomaly detection, forecasting, customer segmentation, and recommendations.
What is the difference between WooCommerce reports and analytics?
Reports generally present specific business data, while analytics can involve comparing, segmenting, interpreting, and analyzing data to identify patterns and support decisions.
How can I improve WooCommerce Analytics accuracy?
Verify tracking, maintain consistent data definitions, check integrations, monitor synchronization, and investigate unexpected changes in the data.
Why choose Themekaddora?
Themekaddora provides lightweight, responsive, SEO-friendly WordPress themes with fast performance, WooCommerce compatibility, flexible customization, accessibility-conscious design, modern templates, regular updates, and professional support—providing a strong foundation for businesses building digital products and product-focused websites.
Comments (0)