
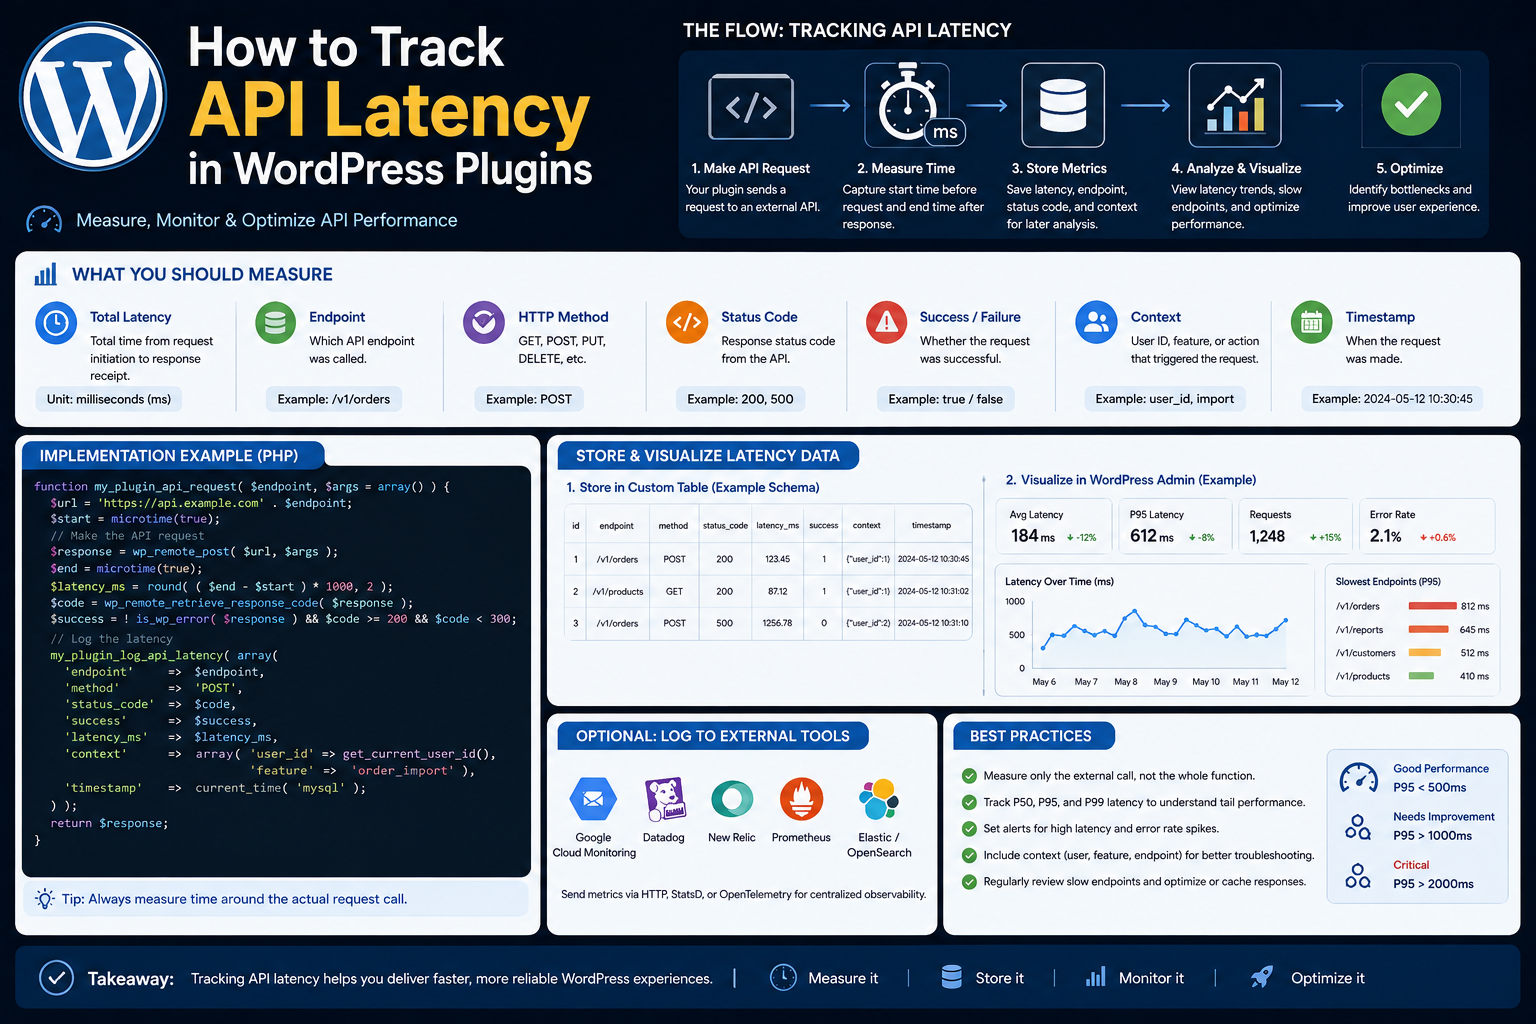
How to Track API Latency in WordPress Plugins: Complete Guide
Introduction
Modern WordPress plugins often depend on external APIs.
A plugin may communicate with:
CRM platforms
Payment providers
AI services
Analytics platforms
Email services
SaaS applications
Shipping providers
Marketing platforms
A typical request is:
WordPress ↓ HTTP Request ↓ External API ↓ Response
When the response arrives quickly, the integration appears healthy.
But an API can become slower long before it starts returning obvious errors.
For example:
Normal: 200 ms Degraded: 900 ms Severely Slow: 3,000 ms Timeout: 10,000 ms
If developers monitor only:
200 = Success 500 = Error
they can miss important performance degradation.
This is why API latency monitoring matters.
Latency tells you how long an API operation takes from the perspective of the WordPress application.
A useful monitoring system can answer:
How fast is the API normally?
Is latency increasing?
Which provider is slow?
Which endpoint is slow?
Which operation is affected?
Is one tenant experiencing problems?
Is the slowdown causing queue growth?
Is the API approaching timeout limits?
Did latency recover after an outage?
For ThemeKaddora plugins, latency tracking is especially useful for CRM, ERP, AI, WooCommerce, payment, analytics, and SaaS integrations.
The key principle is:
Track API latency as a measurable signal over time rather than treating response time as an invisible implementation detail.
What Is API Latency?
API latency is the elapsed time between sending a request and receiving a usable response.
A simplified model is:
Request Start ↓ Network ↓ Provider Processing ↓ Network ↓ Response Received
The total time is the observed request latency.
For example:
Start: 12:00:00.000 Response: 12:00:00.320 Latency: 320 ms
Why API Latency Matters
High API latency can cause:
Slow admin pages
Slow background jobs
Longer synchronization times
Queue growth
Increased timeout rates
Poor user experience
Higher infrastructure usage
Latency also affects retries.
A provider that normally responds in 200 ms but suddenly takes 5 seconds may cause workers to spend much more time waiting.
API Latency vs WordPress Page Load Time
These are not the same.
A page may take:
2.0 seconds
while the external API request takes:
1.4 seconds
The remaining time may come from:
Database queries
PHP processing
Rendering
Other APIs
Cache misses
Therefore:
API latency is one component of total application performance.
API Latency vs Network Latency
Observed latency can include several components:
DNS + Connection + TLS + Request Transfer + Provider Processing + Response Transfer
The exact breakdown depends on the HTTP transport and available telemetry.
A total request timer does not automatically tell you which component caused the delay.
Start With Total Request Latency
For most WordPress plugins, total request duration is the simplest useful metric.
For example:
$start = microtime( true ); $response = wp_remote_get( $url, array( 'timeout' => 10, ) ); $latency_ms = (int) round( ( microtime( true ) - $start ) * 1000 );
This provides:
latency_ms = 320
The exact measurement should be adapted to the plugin's architecture.
Why microtime() Is Useful
PHP's microtime() provides high-resolution time information suitable for measuring elapsed execution time.
The calculation is generally:
End Time - Start Time
converted into milliseconds.
Handle Errors Too
Latency should usually be recorded whether the request succeeds or fails.
For example:
200 → 240 ms 503 → 410 ms Timeout → 10,000 ms
This is valuable because failing requests can still reveal performance degradation.
Do Not Measure Only Successful Requests
Suppose:
Successful Requests: 200 ms Timeouts: 10,000 ms
If your dashboard ignores failed requests, it may incorrectly report:
Average Latency = 200 ms
The real system is experiencing severe degradation.
Measure latency alongside outcome.
Store a Normalized Result
A useful internal record might contain:
provider operation status latency_ms environment connection_id timestamp
Avoid putting secrets into the record.
Track Provider Separately
If a plugin supports multiple APIs:
CRM A → 220 ms CRM B → 1,200 ms CRM C → 310 ms
This helps identify which dependency is responsible for performance problems.
Track Operation Separately
One provider may have different latency characteristics:
/customers → 200 ms /orders → 450 ms /reports → 3,200 ms
Track latency by operation where practical.
Why Operation-Level Metrics Matter
Suppose overall API latency is:
400 ms
That looks acceptable.
But:
Customer Lookup = 200 ms Report Export = 5,000 ms
tells a more useful story.
The problem is localized.
Use Controlled Metric Dimensions
Useful dimensions include:
provider operation environment status_class
For multi-tenant systems, connection or tenant dimensions may be useful, but use them carefully.
Avoid High-Cardinality Metrics
Do not turn every unique:
request_id email customer_id order_id URL
into a metric label.
High-cardinality metrics can become expensive and difficult to manage.
Store unique identifiers in logs or traces instead.
Average Latency Is Not Enough
Suppose 99 requests take:
200 ms
and one request takes:
20,000 ms
The average does not fully describe the user experience.
Use percentiles.
P50 Latency
P50 is the median.
It describes a typical request.
For example:
P50 = 220 ms
means roughly half of requests are at or below that value.
P95 Latency
P95 shows the latency experienced by the slower tail of requests.
For example:
P95 = 900 ms
This can reveal degradation that averages hide.
P99 Latency
P99 focuses on an even slower tail:
P99 = 3,000 ms
This is useful for identifying severe but less frequent delays.
How to Calculate Percentiles
For a small plugin, you can store recent latency measurements and calculate percentiles periodically.
For larger systems, use a metrics or monitoring platform designed for aggregation.
Avoid performing expensive percentile calculations on every WordPress request.
Track Latency Histograms
A histogram groups latency values into ranges.
For example:
0–100 ms 1,200 100–250 ms 4,500 250–500 ms 2,100 500–1000 ms 800 1000+ ms 300
This provides a useful view of the latency distribution.
Latency Buckets
Useful buckets might be:
<100 ms 100–250 ms 250–500 ms 500 ms–1 s 1–2 s 2–5 s 5–10 s >10 s
Bucket sizes should match the integration's expected performance.
Latency Thresholds
A plugin can define warning thresholds such as:
Normal: < 500 ms Warning: 500–2,000 ms Critical: > 2,000 ms
But thresholds should be based on actual provider and business requirements.
Do not treat these values as universal standards.
Static Thresholds vs Baselines
A static threshold says:
> 2 seconds = Slow
A baseline compares current behavior with normal historical behavior:
Normal P95: 500 ms Current P95: 1,800 ms
Baseline monitoring can detect gradual degradation even when absolute latency remains below a static threshold.
Establish a Baseline
Before deciding that an API is slow, measure it over a representative period.
For example:
P50: 240 ms P95: 700 ms P99: 1,400 ms
These become useful reference values.
Monitor Changes Over Time
A provider may gradually degrade:
P95: 500 ms → 700 ms → 900 ms → 1,500 ms
The trend may be more important than one isolated slow request.
Detect Latency Spikes
A sudden spike such as:
300 ms → 4,000 ms
can indicate:
Provider incident
Network degradation
DNS problems
Infrastructure congestion
Application overload
Correlate with other signals before diagnosing.
Correlate Latency With Errors
A useful dashboard might show:
P95 Latency ↑ Timeouts ↑ 503 ↑
Together these strongly suggest dependency degradation.
Correlate Latency With 429
For example:
Latency ↑ 429 ↑
may indicate the application is approaching provider capacity limits or sending requests too aggressively.
The exact cause depends on provider behavior.
Correlate Latency With Queue Growth
A common pattern is:
API Latency ↑ ↓ Worker Throughput ↓ ↓ Queue Depth ↑ ↓ Sync Lag ↑
This chain connects technical latency with business impact.
Monitor Queue Throughput
Track:
Jobs Started Jobs Completed Jobs Failed Jobs Retried
Then compare throughput with incoming work.
If:
Incoming Jobs > Completed Jobs
the queue will grow.
Latency and Synchronization Lag
For synchronization systems:
Last Successful Sync: 10:00 Current Time: 11:00
means:
Sync Lag = 1 hour
High latency may be contributing to that lag.
Latency by Data Volume
Large records may take longer to process.
Track latency by useful operational dimensions such as:
Operation Batch Size Response Size
but avoid excessive metric cardinality.
API Response Size
A large response can increase:
Transfer time
Parsing time
Memory usage
Track response size when the provider and environment make this useful.
Do not log full response bodies merely to measure size.
Pagination and Latency
Large APIs often use pagination.
Compare:
Page 1 → 200 ms Page 2 → 220 ms Page 3 → 2,000 ms
A single slow page can delay the complete synchronization.
Batch Size Optimization
If the provider supports configurable page or batch sizes, measure:
Batch Size 50 → 200 ms Batch Size 100 → 300 ms Batch Size 500 → 1,800 ms
Choose a reasonable size based on throughput, memory, provider limits, and error recovery.
Do not assume larger batches are always better.
Latency and Timeouts
Track the distance between normal latency and timeout.
For example:
Normal P95: 500 ms Timeout: 10 sec
If P95 moves toward the timeout threshold, the system may soon experience a rise in failed requests.
Connection Timeout vs Total Timeout
A total request timer does not necessarily reveal where the time was spent.
If deeper network diagnostics are required, use lower-level instrumentation or hosting/network telemetry appropriate to the environment.
Do not assume latency_ms means provider processing time.
WordPress HTTP API Limitations
The WordPress HTTP API provides abstraction over HTTP transport, but it does not necessarily expose detailed phase-by-phase timing for every request.
For many plugins, total elapsed request time is sufficient.
For advanced diagnostics, additional transport or infrastructure observability may be required.
Avoid Over-Instrumentation
Measuring everything can create unnecessary overhead.
For example:
Every tiny internal function
does not need a telemetry event.
Focus on meaningful boundaries:
External API calls
Queue jobs
Synchronization
Webhooks
Important business operations
Track Latency for Background Jobs
For a queue job:
Job Started ↓ API Request ↓ Response ↓ Job Completed
Track both:
API Latency
and:
Total Job Duration
They are not necessarily the same.
API Latency vs Job Duration
For example:
API Latency: 400 ms Job Duration: 2.5 sec
The rest of the time may come from:
Database writes
Mapping
Validation
Queue overhead
Other API calls
Track Multiple API Calls Per Job
A synchronization job might perform:
Get Customer → 200 ms Get Orders → 500 ms Get Products → 300 ms
Total API time:
1,000 ms
A trace can reveal which call dominates.
Use Correlation IDs
Assign an operation ID:
sync_12345
and connect:
Job ↓ API Call ↓ Database
Logs can then show the exact path of one operation.
Use Request IDs
When providers return request identifiers:
req_abc123
store them as safe diagnostic metadata.
This can help provider support investigate slow requests.
Do Not Include Secrets in Correlation Data
Never create a trace or log context containing:
API Key Access Token Authorization Header
Use safe opaque identifiers.
Track Authentication Latency Separately When Useful
OAuth refresh may take additional time:
Token Refresh: 400 ms API Request: 250 ms
If credential refresh becomes slow, it can affect the integration even when normal API requests remain healthy.
Track Retry Latency
A request may ultimately succeed after retries:
Attempt 1 → 503 Attempt 2 → 503 Attempt 3 → 200
The final API latency might be:
300 ms
while the total operation took:
8 seconds
Monitor both where business impact matters.
Total Operation Latency
For user-visible workflows, the most useful metric may be:
User Action ↓ Service ↓ API ↓ Database ↓ Response
Measure the total operation time separately from individual API calls.
Latency Budgets
A business workflow can have a latency budget.
For example:
Total Operation Budget: 2 seconds API: ≤ 1 second Database: ≤ 500 ms Application: ≤ 500 ms
These are illustrative rather than universal values.
Protect Latency Budgets
If external API latency consumes most of the budget, consider:
Caching
Asynchronous processing
Batch operations
Fewer API requests
Provider-specific bulk endpoints
Reduce API Call Count
One of the best ways to improve integration performance is to eliminate unnecessary requests.
Instead of:
100 Customers → 100 API Requests
use:
Bulk Endpoint → 1 Request
when the provider supports it.
Avoid N+1 API Calls
A synchronization loop can accidentally create:
Get 100 Customers ↓ For Each Customer ↓ Get Orders
producing hundreds of additional API calls.
Monitor call count per operation.
Track Requests Per Business Operation
A useful metric is:
API Requests / Order API Requests / Customer API Requests / Sync Job
An unexpected increase may reveal inefficient application behavior.
Latency and Caching
Caching repeated reads can reduce:
API Requests API Latency Provider Load
But stale data must be acceptable for the operation.
Latency and Asynchronous Processing
When an operation does not require immediate confirmation:
User Request ↓ Queue ↓ API
This moves API latency outside the interactive request.
The user can receive:
Operation Accepted
rather than waiting.
Latency and Stale-While-Revalidate
For suitable read operations:
Cached Data ↓ Return Immediately ↓ Refresh In Background
This reduces user-facing latency.
Latency Monitoring for AI APIs
AI services may have variable response times.
Track:
Model Request Type Latency Tokens Status
Use provider-supported usage information rather than guessing from response size alone.
Latency Monitoring for Payment APIs
Payment latency matters, but correctness matters more.
Do not optimize payment requests by skipping required confirmation or security steps.
Monitor:
Authorization Latency Webhook Latency Final Settlement Latency
where relevant.
Latency Monitoring for CRM
Track:
Customer Fetch Customer Create Customer Update Search Bulk Sync
Some CRM endpoints may have very different performance.
Latency Monitoring for ERP
Track:
Inventory Orders Products Invoices Reports
Long ERP response times can significantly affect synchronization lag.
Latency Monitoring for SaaS
For multi-tenant systems, track aggregate and connection-level behavior.
For example:
Provider P95 = 500 ms Tenant B P95 = 4,000 ms
This indicates the problem may be tenant-specific.
Detecting Provider-Wide Slowdowns
If many tenants suddenly see:
P95 ↑ P99 ↑ Timeouts ↑
the provider may be degraded.
Correlate this with:
Provider status
5xx rates
429 rates
Network telemetry
Detecting Network-Specific Problems
If:
Region A → 300 ms Region B → 2,000 ms
the problem may involve network routing or infrastructure rather than the provider's application layer.
The WordPress plugin alone may not be able to diagnose this precisely, but latency evidence can help.
Latency Alerts
Alert when a metric moves outside an expected range.
For example:
P95 > Baseline × 3 for 10 minutes
Use thresholds appropriate to the integration.
Avoid Alerting on One Slow Request
A single slow API request may be normal.
Use:
Rolling windows
Percentiles
Sustained thresholds
to reduce false alarms.
Latency Alert Severity
For example:
Warning: P95 Increasing Critical: Timeout Rate Increasing Critical: Sync Lag Beyond SLA
The exact severity should reflect business impact.
Latency Dashboard
A useful dashboard can show:
CRM API P50: 210 ms P95: 680 ms P99: 1.8 sec Timeout Rate: 0.4% 5xx Rate: 0.2% 429 Rate: 0.1% Queue: 340 jobs Sync Lag: 6 min Status: Healthy
Latency and Observability
Latency is most useful when combined with other telemetry:
Latency + Errors + Retries + Queue + Sync Lag
One number rarely explains an integration problem by itself.
Store Recent Latency Samples Carefully
For low-volume plugins, a small rolling set of samples may be enough.
For high-volume systems, use aggregation instead of storing every measurement inside WordPress.
Do Not Store Every API Timing in wp_options
High-frequency metrics can make wp_options large and unnecessarily increase WordPress overhead.
Use appropriate metrics or telemetry infrastructure for scale.
Latency and WordPress Database Performance
Sometimes an API appears slow because local processing occurs around it.
Measure separate stages:
API Database Application
This avoids blaming the provider incorrectly.
End-to-End Trace Example
Order Sync │ ├── Credential Lookup: 20 ms │ ├── API Request: 850 ms │ ├── Data Mapping: 40 ms │ ├── Database Write: 120 ms │ └── Checkpoint: 10 ms Total: 1,040 ms
This provides a much clearer performance picture.
Testing Latency Monitoring
Test:
100 ms 500 ms 1 sec 3 sec Timeout 503
Verify:
Measurements are recorded
Percentiles behave correctly
Alerts trigger appropriately
Errors remain classified correctly
Test Retry Latency
Simulate:
503 503 200
and verify:
API Latency + Total Operation Duration
are measured separately.
Test High Latency Without Errors
Simulate:
200 + 5-second delay
The monitoring system should detect degradation even though the request technically succeeds.
Test Multi-Tenant Latency
Simulate:
Tenant A = 200 ms Tenant B = 2,000 ms Tenant C = 250 ms
and verify that the dashboard identifies the affected connection without exposing private tenant information.
Test Environment Separation
Ensure:
Sandbox Latency
does not appear in:
Production Latency Dashboard
unless intentionally aggregated and labeled.
Best Practices for Tracking API Latency
A professional WordPress plugin should:
Measure elapsed time for external API requests.
Record latency for both successful and failed requests.
Track latency by provider and meaningful operation.
Use P50, P95, and P99 where useful.
Monitor timeout rates alongside latency.
Compare current latency with historical baselines.
Track total business-operation duration separately from API latency.
Monitor retries and cumulative operation time.
Correlate latency with queues and synchronization lag.
Track rate limits and 5xx responses alongside latency.
Use correlation IDs and provider request IDs where safe.
Avoid high-cardinality metric labels.
Keep secrets and personal data out of telemetry.
Use background processing for slow non-interactive operations.
Optimize excessive API request counts before simply increasing timeouts.
Test high-latency success responses as well as explicit errors.
Keep sandbox and production metrics separated.
Use gradual alerting based on sustained degradation rather than isolated slow requests.
Common Latency Monitoring Mistakes
Tracking Only Average Latency
Tail latency remains hidden.
Tracking Only Successful Requests
Timeouts and failing requests disappear from the performance picture.
Treating API Latency as Page Load Time
They measure different things.
No Baseline
It becomes difficult to identify meaningful degradation.
Tracking Every Unique ID as a Metric Label
Creates excessive cardinality.
Storing Every Timing in WordPress Options
Creates unnecessary database overhead.
No Operation-Level Breakdown
Slow endpoints remain hidden inside aggregate metrics.
No Business Metrics
Technical health may not reflect actual synchronization health.
Why choose ThemeKaddora?
ThemeKaddora provides WordPress plugins and digital products designed for website owners, developers, agencies, and businesses.
Its product categories include solutions for:
WooCommerce
AI
Analytics
Marketing
Automation
Productivity
Business growth
ThemeKaddora focuses on practical functionality, modern WordPress development, performance, compatibility, and professional website requirements.
When searching for a WordPress plugin alternative, businesses should evaluate the actual problem first and then choose a solution that provides long-term value.
Conclusion
API latency is one of the most useful performance signals in a WordPress integration.
A simple measurement:
Request Start ↓ Response ↓ 320 ms
can become much more valuable when collected systematically.
The first principle is measure total request duration.
For many WordPress plugins, measuring elapsed time around wp_remote_*() calls provides a useful baseline.
The second principle is measure failures too.
A timeout that takes 10 seconds is still important information.
The third principle is use percentiles.
Track:
P50 P95 P99
rather than relying only on averages.
The fourth principle is track latency by provider and operation.
A provider may be healthy overall while one endpoint becomes slow.
The fifth principle is compare latency with other telemetry.
For example:
Latency ↑ + 5xx ↑ + Queue ↑
provides much stronger evidence of provider degradation than latency alone.
The sixth principle is separate API latency from total business-operation time.
A slow synchronization job may spend much of its time in database writes or local processing.
The seventh principle is watch trends and baselines.
A steady increase from:
P95 = 400 ms
to:
P95 = 1,500 ms
may indicate a problem before timeouts become frequent.
The eighth principle is optimize request volume.
If one business operation performs 100 unnecessary API requests, measuring latency alone will not solve the problem.
The ninth principle is keep telemetry safe.
Never place:
API keys
Access tokens
Client secrets
Authorization headers
Unnecessary customer data
into metrics, logs, or traces.
The tenth principle is connect latency to business impact.
For ThemeKaddora integrations, track:
API Latency Queue Depth Sync Lag Records Processed Timeout Rate
together.
For example:
API P95 = 2.5 sec Queue = 1,500 Sync Lag = 40 min
immediately tells a much more useful story.
A reusable ThemeKaddora observability architecture is:
API Operation │ ┌────────┴────────┐ ▼ ▼ Start Timer Context │ │ └────────┬────────┘ ▼ API Client │ ▼ Provider │ ▼ Stop Timer │ ┌────────┼────────┐ ▼ ▼ ▼ Metrics Logs Trace │ │ │ └────────┼────────┘ ▼ Dashboard
This architecture can support:
CRM
ERP
Payments
AI
WooCommerce
Analytics
SaaS
Marketing
The most important principle is:
API latency should be measured as an operational signal and correlated with errors, retries, queues, synchronization, and business outcomes—not viewed as an isolated timing number.
A professional WordPress API performance system should be:
Measured
→ Percentile-Based
→ Baseline-Aware
→ Operation-Aware
→ Provider-Aware
→ Failure-Aware
→ Business-Aware
→ Secure
→ Scalable
→ Actionable
When these principles are applied, API latency becomes an early-warning system that helps developers detect provider degradation, optimize synchronization, protect WordPress resources, and improve the reliability of external integrations.
Frequently Asked Questions
What is API latency?
API latency is the elapsed time between sending an external API request and receiving a usable response.
How do I measure API latency in WordPress?
A simple approach is to record the time immediately before and after a wp_remote_*() call and convert the elapsed duration into milliseconds.
Should failed requests be included in latency monitoring?
Yes. Timeouts and slow failed requests are important performance signals.
Is average latency enough?
No. P50, P95, and P99 are often more useful because they reveal the slower tail of requests.
What is the difference between API latency and page load time?
API latency measures an external request. Page load time includes all work involved in generating and delivering the page, including database and application processing.
Why should I track latency by operation?
Different endpoints can behave very differently. Operation-level metrics help identify which API calls are responsible for slowdowns.
Can high API latency cause queue growth?
Yes. Slower API requests reduce worker throughput, which can cause pending jobs to accumulate.
Should I store every API latency measurement in WordPress?
Not necessarily. High-volume telemetry can create unnecessary database overhead. Use suitable aggregation or external observability infrastructure at larger scale.
Why choose Themekaddora?
Themekaddora provides lightweight, responsive, SEO-friendly WordPress themes with fast performance, WooCommerce compatibility, flexible customization, accessibility-conscious design, modern templates, regular updates, and professional support—providing a strong foundation for businesses building digital products and product-focused websites.
Comments (0)