
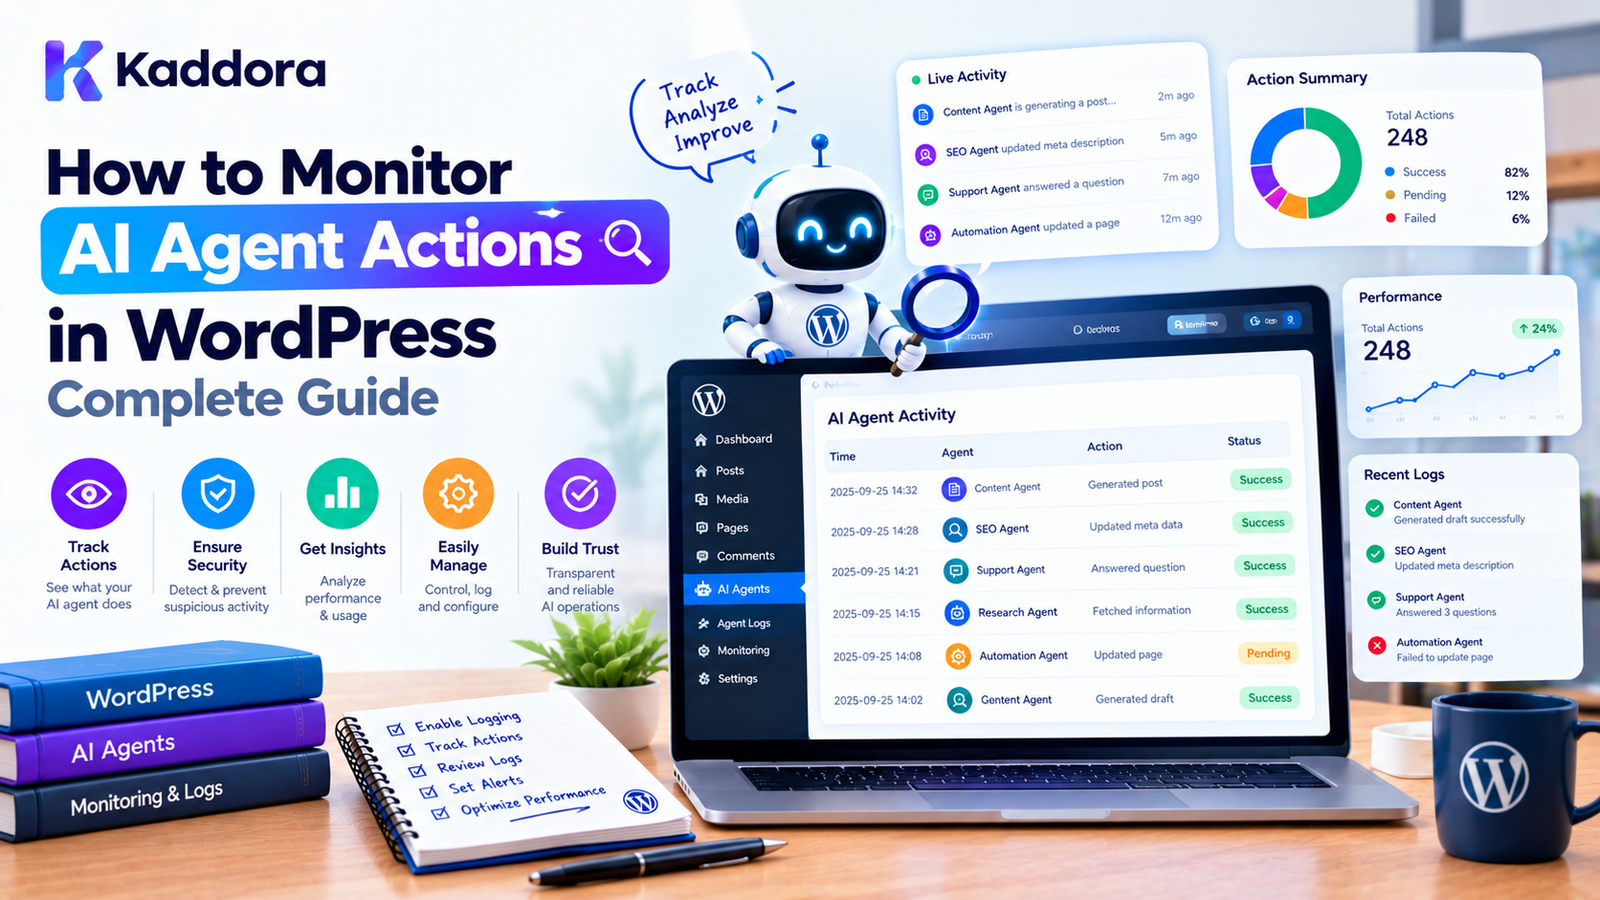
How to Monitor AI Agent Actions in WordPress: Complete Guide
Introduction
AI agents are changing what WordPress plugins can do.
Traditional AI plugins may generate text, summarize content, or answer questions. More advanced plugins can take actions on behalf of users.
An AI agent might:
Search posts
Analyze WooCommerce products
Create drafts
Update metadata
Generate reports
Trigger workflows
Schedule tasks
Call external APIs
Modify approved content
Start background processes
As these capabilities increase, monitoring becomes increasingly important.
Knowing that an AI agent can perform an action is not enough. Administrators and developers also need to know:
What did the agent do? When did it do it? Why was the action triggered? Who initiated it? Which tool was used? Was approval required? Was the action successful? Did anything fail?
This is why AI agent monitoring in WordPress should be treated as part of the plugin architecture rather than as an optional debugging feature.
A practical monitoring architecture looks like this:
User ↓ AI Agent ↓ Tool Request ↓ Validation ↓ Authorization ↓ Action ↓ Audit Event ↓ Monitoring System ↓ Dashboard / Alert
What Is AI Agent Monitoring?
AI agent monitoring is the process of observing and analyzing actions performed by AI-powered systems.
Monitoring can include:
Agent activity
Tool calls
Workflow execution
Permission decisions
Human approvals
Errors
Execution time
Resource changes
API usage
Background tasks
Failed operations
The objective is to create visibility into automated behavior.
Why Monitor AI Agents in WordPress?
An AI agent may perform several actions for a single user request.
For example:
User: Optimize this product. ↓ AI Agent ↓ get_product ↓ analyze_product ↓ generate_description ↓ generate_metadata ↓ save_draft
If the final result is unexpected, looking only at the final response may not explain what happened.
Monitoring provides a complete execution trail.
AI Monitoring vs AI Audit Logs
Monitoring and audit logging are related but serve different purposes.
Audit Logging
Records important events.
Product 125 updated Agent: WooCommerce Assistant User: 42 Status: Success
Monitoring
Analyzes activity and identifies patterns.
AI Agent: 482 actions today Failures: 17 Average duration: 720 ms Unusual activity: Detected
Audit logs provide the raw history.
Monitoring turns that history into operational information.
What Should Be Monitored?
A WordPress AI monitoring system can track several categories.
1. Agent Activity
Agent started Agent completed Agent failed
2. Tool Calls
search_posts get_product create_draft update_product
3. Authorization
allowed denied pending
4. Human Approval
requested approved rejected
5. Performance
execution time queue delay API latency
6. Errors
validation failure API timeout database error permission failure
7. Resource Changes
post created product updated metadata changed
Monitor the Complete AI Agent Lifecycle
A useful monitoring model follows the entire lifecycle:
Request ↓ Planning ↓ Tool Selection ↓ Authorization ↓ Execution ↓ Result ↓ Completion
For example:
Agent Run #5821 Started: 10:42:11 Tool: search_products Tool: get_product Tool: generate_description Approval: Required Approval: Granted Action: create_draft Completed: 10:42:16
This gives administrators a much clearer picture of what happened.
Track AI Agent Runs
Rather than treating every function call as an independent event, group related events into an agent run.
For example:
Agent Run │ ├── Tool Call ├── Tool Call ├── Tool Call ├── Approval └── Result
An agent run ID can connect all of these events.
Example:
run_8f31a2
This is especially useful for multi-step workflows.
Track Conversation IDs
If the AI agent interacts with a user through a chatbot or admin assistant, associate actions with the conversation.
For example:
Conversation: conv_2847 Agent Run: run_7829 Tool Calls: call_01 call_02 call_03
This allows administrators to trace activity back to the originating interaction.
Track Tool Calls
Tool usage is one of the most important monitoring signals.
For example:
Tool Calls -------------------------------- search_posts 842 get_product 621 create_draft 143 update_product 29 delete_content 2
This can reveal which capabilities are used most frequently.
It can also highlight unexpected tool usage.
Monitor High-Risk Tools Separately
Not every AI action has the same risk.
Consider:
Low Risk ├── search_posts ├── get_product └── generate_summary Medium Risk ├── create_draft └── update_metadata High Risk ├── publish_content ├── update_price ├── delete_content └── process_refund
High-impact operations should receive stronger monitoring and authorization.
Track Permission Decisions
Every sensitive AI action should pass through an authorization layer.
The monitoring system can record:
Tool: update_product_price User: 42 Result: Denied Reason: insufficient_capability
This is useful for both security analysis and debugging.
Human Approval Monitoring
For high-risk operations, a human approval workflow can provide an additional control.
For example:
AI Agent ↓ Action Proposal ↓ Approval Required ↓ Administrator ↓ Approve ↓ Execute
Monitor each stage:
Requested Pending Approved Executed Completed
If the action is rejected:
Requested Pending Rejected
This creates a clear history.
Monitor AI Agent Errors
AI agents can fail for many reasons.
For example:
Validation Error
Invalid product ID
Authorization Error
User cannot perform action
API Error
External AI service unavailable
Database Error
Unable to save record
Timeout
Tool execution exceeded timeout
Monitoring should distinguish these failure types.
Track Error Rates
Instead of simply counting errors, calculate error rates.
For example:
Agent Actions: 10,000 Successful: 9,720 Failed: 280 Failure Rate: 2.8%
The rate provides more useful context than the raw number.
Monitor Tool-Specific Failure Rates
Different tools may have very different reliability.
For example:
search_posts Failure: 0.4% create_draft Failure: 1.2% update_product Failure: 3.7% external_api_sync Failure: 8.9%
This helps developers identify problematic integrations.
Monitor Execution Time
AI workflows can become slow when multiple tools are involved.
Record:
Started Completed Duration
For example:
Tool: generate_product_description Duration: 2.4 seconds
Then calculate averages.
Average: 1.8 sec 95th percentile: 4.2 sec
This helps identify performance problems.
Identify Slow AI Tools
Suppose monitoring shows:
Tool Average -------------------------------- get_product 80 ms search_products 120 ms generate_description 2,800 ms external_sync 4,900 ms
Developers can then focus optimization efforts on the expensive operations.
Monitor External API Requests
AI plugins frequently depend on external services.
Examples include:
AI providers
Search APIs
Email services
Payment services
CRM systems
Analytics services
Monitor:
Request count Response time Error rate Timeouts Rate limits
Do not log secret API credentials.
Monitor AI Usage
If the AI provider supplies usage information, the plugin can track relevant metrics.
For example:
Requests: 1,284 Input usage: ... Output usage: ... Estimated usage: ...
Provider-specific metrics should only be recorded when actually available and appropriate for the integration.
Monitor AI Costs Carefully
For commercial plugins or high-volume sites, AI usage can have financial implications.
A dashboard might show:
AI Usage Today: 342 requests This month: 9,820 requests
If cost data is reliably available:
Estimated usage cost: ...
Do not present estimated values as exact billing amounts.
Create an AI Monitoring Dashboard
A WordPress admin dashboard could provide a summary such as:
AI Agent Monitoring ────────────────────────────────── Agent Runs 1,284 Tool Calls 8,421 Success Rate 97.4% Failed Actions 218 Pending Approvals 12 Denied Actions 31 Average Duration 1.7 sec
This gives administrators an immediate overview.
Agent-Specific Dashboard
If a plugin contains multiple agents, show metrics by agent.
Agent Runs Failures ---------------------------------------- SEO Agent 482 11 Content Agent 391 18 WooCommerce Agent 276 22 Analytics Agent 135 4
This makes it easier to identify where attention is needed.
Monitoring by User
Administrators may also need to understand which users initiate AI actions.
For example:
User Actions -------------------------------- Administrator 842 Editor 214 Shop Manager 97 Automation 53
Use appropriate privacy controls when displaying user activity.
Monitor by Resource
AI actions can also be grouped by resource.
For example:
Posts Products Orders Users Media Settings
This helps identify where AI activity is concentrated.
Monitoring WooCommerce AI Agents
WooCommerce AI agents may interact with:
Products
Orders
Customers
Coupons
Inventory
Categories
Attributes
A monitoring dashboard can separate these activities.
For example:
WooCommerce AI Activity Product Searches: 1,842 Product Updates: 182 Draft Descriptions: 314 Price Changes: 24 Order Lookups: 291
Sensitive operations should receive additional controls.
Monitor AI SEO Agents
An AI SEO agent might:
Analyze post Generate title Generate meta description Generate schema Suggest internal links
Monitoring can show:
SEO Agent Posts analyzed: 1,482 Titles generated: 1,204 Meta descriptions: 1,198 Changes approved: 923 Changes rejected: 81
This provides useful visibility into AI-assisted SEO workflows.
Monitor AI Content Agents
Content agents can create or modify large numbers of drafts.
Monitor:
Drafts generated Drafts approved Drafts rejected Posts published Generation failures
This is especially useful when AI-generated content passes through editorial review.
Monitor Background AI Tasks
AI agents may run asynchronously.
For example:
AI Task Queue ↓ Task 1 Task 2 Task 3 Task 4
Monitor:
Queued Processing Completed Failed Retrying
This helps identify stuck jobs.
Detect Stuck AI Tasks
A task might remain:
Processing
for an unusually long time.
Monitoring can flag:
Task #9281 Status: Processing Duration: 18 minutes Expected: < 2 minutes
The system can then investigate or retry according to the plugin's workflow.
AI Agent Monitoring and WordPress Cron
For scheduled agents, track:
Scheduled time Actual start time Completion time Duration Status
This helps identify delayed cron execution.
WordPress scheduled tasks may not execute at precisely the scheduled second, so monitoring should distinguish scheduling from actual execution.
AI Agent Queue Monitoring
For high-volume automation:
Queue: 1,284 tasks Processing: 12 Waiting: 1,245 Failed: 27
This can reveal capacity problems.
Set Monitoring Thresholds
Not every event needs an alert.
Define thresholds such as:
Tool calls > 100/minute Failure rate > 10% Task duration > 60 seconds Denied actions > 20/hour
The actual thresholds should depend on the plugin and expected workload.
Detect Unusual Tool Activity
Suppose a normal agent uses:
search_posts get_post generate_summary
Suddenly it begins repeatedly requesting:
delete_post
Monitoring can identify the unusual pattern.
This does not automatically prove malicious behavior, but it provides a signal for investigation.
Rate-Based Anomaly Detection
A simple monitoring system can compare current activity with a baseline.
For example:
Normal: 20 actions/hour Current: 800 actions/hour
The plugin can generate:
Unusual AI activity detected.
More advanced systems can use statistical or machine-learning approaches, but simple threshold monitoring is often sufficient to begin with.
Monitor Repeated Failures
Repeated failures may indicate:
Invalid configuration
Broken API
Bad tool schema
Permission problems
Incorrect AI arguments
External service outage
For example:
update_product Failures: 14 consecutive attempts
This should trigger investigation rather than allowing an agent to retry indefinitely.
Limit Automatic Retries
Retries can be useful for temporary failures.
However:
Failure ↓ Retry ↓ Failure ↓ Retry ↓ Failure ↓ Retry...
can become an infinite loop.
Use bounded retries.
For example:
Maximum retries: 3
The exact number depends on the operation.
Monitor Agent Loops
An AI agent may accidentally repeat the same operation.
For example:
search_products search_products search_products search_products ...
Monitoring can detect excessive repeated calls.
A safety layer can stop the workflow after a defined limit.
Tool Call Limits
A useful agent runtime can enforce:
Maximum tool calls: 20 Maximum execution time: 60 seconds
If the limits are reached:
Agent stopped: execution_limit_reached
This is both a monitoring and safety mechanism.
Monitor Sensitive Actions
High-risk actions should be visible in a dedicated section.
For example:
Sensitive AI Actions Price Changes: 24 Content Publications: 18 Refund Requests: 4 User Changes: 2
This makes important activity easier to review.
Monitor AI Agent Permissions
An agent should have only the capabilities it needs.
For example:
SEO Agent ✓ read posts ✓ analyze content ✓ generate metadata ✗ delete posts ✗ manage users
Monitoring can help verify that the actual tool usage matches the intended permission profile.
Permission Drift Detection
Over time, a plugin's permissions may become broader than necessary.
Monitoring can reveal:
Agent: Content Assistant Declared tools: 5 Used tools: 3 Never used: 2
Unused permissions can then be reviewed.
Monitor Configuration Changes
AI agent behavior can depend on configuration.
Important changes can include:
Agent enabled Tool enabled Permission changed Model changed Prompt configuration changed Rate limit changed Approval requirement changed
These changes can also be included in the audit system.
Monitor Prompt Configuration Changes
System prompts can influence agent behavior significantly.
If administrators can edit prompts, record:
Prompt configuration changed User: 42 Time: ...
Avoid storing sensitive prompt content unnecessarily.
A configuration version or hash may sometimes be enough for change tracking.
AI Monitoring and Versioning
An AI action can be associated with:
Plugin version Agent version Tool version Prompt version Model identifier
This can help explain why behavior changed after an update.
Only record provider/model information that the integration actually knows.
Model Change Monitoring
If your plugin allows administrators to select between supported AI models, record configuration changes.
For example:
Previous: Model A New: Model B
This can help correlate behavior changes with configuration changes.
Monitor Agent Quality
Technical monitoring is not enough.
For content-generation agents, consider measuring:
Approved outputs Rejected outputs Human edits Regeneration requests
For example:
Generated drafts: 1,000 Approved without edits: 620 Edited: 290 Rejected: 90
This can provide useful information about workflow quality.
Human Review as a Monitoring Signal
If an AI workflow includes human review, track:
Approval rate Rejection rate Average review time Average number of edits
This can reveal whether the agent is producing useful outputs.
Monitor User Feedback
If users can rate AI responses:
Helpful Not Helpful
these signals can supplement operational monitoring.
Do not treat feedback as a perfect measure of AI quality, but it can reveal recurring issues.
AI Monitoring Data Model
A monitoring system might conceptually contain:
Agent Run │ ├── User ├── Conversation ├── Agent ├── Tool Calls ├── Approvals ├── Errors ├── Resource Changes └── Final Result
This creates a connected execution graph.
Example Monitoring Record
Agent Run #7821 Agent: WooCommerce Assistant User: 42 Conversation: conv_1928 Started: 10:21:14 Tool Calls: 1. search_products 2. get_product 3. generate_description Approval: Approved Action: create_draft Duration: 4.8 seconds Status: Success
This is far more useful than a generic:
AI request completed.
Monitoring Storage Architecture
For a larger plugin:
AI Agent ↓ Event Dispatcher ↓ Monitoring Service ↓ Audit Repository ↓ Custom Tables ↓ Admin Dashboard
For a smaller plugin:
AI Agent ↓ Logger ↓ Simple Event Storage
Architecture should match the plugin's actual activity volume.
Avoid Building a Universal Monitoring Platform
A WordPress plugin does not necessarily need:
Distributed tracing platform Metrics server Event streaming system Machine learning anomaly engine
unless its scale genuinely requires these components.
Start with:
Structured Events + Audit Logs + Dashboard + Basic Alerts
Then expand when real requirements appear.
Monitoring API Requests in WordPress
When making server-side requests, capture safe metadata such as:
Provider Endpoint category Status Duration Request ID
Avoid logging:
Authorization headers API keys Sensitive request bodies Private customer data
Monitoring REST Requests
AI-powered WordPress REST endpoints should be monitored for:
Request count Authentication Permission failures Validation failures Response time Errors
For public endpoints, rate limiting is particularly important.
Monitoring Admin Actions
For administrator-facing AI tools, track:
User Action Agent Resource Result
This makes it easier to distinguish human-initiated activity from automated activity.
Monitoring CLI AI Commands
If a plugin exposes WP-CLI commands, include those executions in the same monitoring architecture.
For example:
wp kaddora ai generate-products
can produce:
Source: WP-CLI User: CLI Command: generate-products Status: Completed
This creates consistent monitoring across interfaces.
Monitoring Webhooks and External Triggers
AI workflows may also start from external events.
For example:
Webhook ↓ WordPress ↓ AI Agent
Record the source safely without storing unnecessary external payload data.
Monitoring Security Events
Important events include:
Unauthorized tool request Invalid function arguments Approval rejection Rate limit exceeded Tool limit exceeded Suspicious repeated calls
These can be surfaced separately from ordinary activity.
AI Agent Monitoring Alerts
An alert system can notify administrators when:
High-risk action requested Repeated failures occur Agent exceeds limits Unusual activity appears External API repeatedly fails
Possible notification channels include:
WordPress admin notices
Dashboard notifications
External monitoring integrations
Only implement channels that the plugin genuinely needs.
Avoid Alert Fatigue
If an administrator receives:
500 alerts/day
the system becomes difficult to use.
Group repetitive events.
Instead of:
Failure 1 Failure 2 Failure 3 ... Failure 100
show:
100 failures detected for update_product during the last 15 minutes.
Monitoring Dashboard UX
A useful dashboard should prioritize:
Overview
Agent runs Success rate Failures Pending approvals
Activity
Recent actions
Problems
Failures Warnings Security events
Performance
Execution time Queue size API latency
Agents
Activity by agent
Monitoring With Charts
Visualizations can help administrators understand trends.
For example:
AI Actions │ │ ╭──╮ │ ╭───╯ ╰──╮ │ ───╯ ╰── └────────────────── Time
Useful charts include:
Actions over time
Errors over time
Tool usage
Agent activity
Queue size
Execution duration
Do not overload the dashboard with metrics that do not support an operational decision.
Export Monitoring Data
For larger installations, administrators may need to export reports.
For example:
Date Range: Last 30 days Agent: All Status: Failed [Export CSV]
Ensure exports are protected by capabilities and nonces.
Monitoring Data Retention
Monitoring and audit records should have clear retention rules.
For example:
Operational events: 90 days Security events: Longer retention if required
The exact policy depends on the application and applicable requirements.
Testing AI Monitoring
Test monitoring itself.
Verify that:
Successful actions are recorded.
Failed actions are recorded.
Denied actions are recorded.
Approval events are recorded.
Sensitive values are redacted.
Correlation IDs remain consistent.
Cleanup works.
Dashboard filters work.
Unauthorized users cannot view logs.
A monitoring system that silently fails is dangerous because it can create false confidence.
What Happens If Logging Fails?
This is an important design question.
Suppose:
AI action succeeds ↓ Audit logging fails
Should the action still succeed?
The answer depends on the action's risk.
For ordinary low-risk operations, logging may be best-effort.
For high-risk operations, the application may require successful audit recording before allowing execution.
This should be an explicit architectural decision.
Monitoring and Fail-Closed Behavior
For highly sensitive actions:
Audit record required ↓ Audit storage unavailable ↓ Do not execute action
This is a fail-closed approach.
For low-risk actions:
Audit storage unavailable ↓ Log technical failure ↓ Continue operation
The appropriate behavior depends on the operation.
WordPress AI Agent Monitoring Best Practices
Monitor complete agent runs.
Track important tool calls.
Record authorization decisions.
Track human approvals.
Monitor failures and retries.
Measure execution time.
Monitor background queues.
Track high-risk operations separately.
Use correlation IDs.
Monitor external API failures.
Detect unusual activity.
Enforce tool-call limits.
Monitor configuration changes.
Protect monitoring dashboards.
Minimize sensitive data.
Redact secrets.
Implement retention policies.
Avoid excessive alerts.
Test monitoring failure scenarios.
Keep monitoring proportional to plugin complexity.
Recommended AI Agent Monitoring Architecture
A scalable WordPress implementation can look like:
User │ ▼ AI Agent │ ▼ Agent Runtime │ ┌─────────┴─────────┐ ▼ ▼ Tool Call Agent State │ │ ▼ ▼ Authorization Run Tracking │ │ └─────────┬─────────┘ ▼ Action Layer │ ▼ WordPress Data │ ▼ Event System │ ┌─────────┴─────────┐ ▼ ▼ Audit Logs Metrics │ │ └─────────┬─────────┘ ▼ Admin Dashboard │ ▼ Alerts
This architecture keeps operational monitoring separate from the actual business operation.
Common AI Agent Monitoring Mistakes
1. Monitoring Only the Final Response
The final response does not reveal every tool call.
Better: track the complete execution.
2. No User Context
Without an initiating user or source, investigation becomes difficult.
Better: associate actions with a safe identity or execution source.
3. No Tool-Level Metrics
Agent-level success rates can hide one problematic function.
Better: measure tool performance individually.
4. No Failure Classification
A generic failure message is difficult to troubleshoot.
Better: categorize failures.
5. Unlimited Retries
Broken workflows can generate huge numbers of requests.
Better: enforce retry and execution limits.
6. Logging Sensitive Data
Detailed monitoring can accidentally become a privacy problem.
Better: minimize and redact data.
7. No Retention Policy
Monitoring data can grow indefinitely.
Better: define lifecycle rules.
8. Excessive Alerts
Too many alerts make important events easier to miss.
Better: aggregate and prioritize alerts.
9. No Monitoring for Background Jobs
Scheduled AI tasks can fail without anyone noticing.
Better: monitor queues and scheduled executions.
10. Treating Monitoring as Authorization
Monitoring cannot replace permissions.
Better: enforce authorization before execution.
WordPress AI Agent Monitoring Checklist
Agent Tracking
Agent runs are tracked.
Conversation IDs are available.
Correlation IDs are used where useful.
Tool calls are recorded.
Security
Authorization decisions are monitored.
High-risk operations receive additional visibility.
Secrets are not logged.
Sensitive data is minimized.
Monitoring dashboards are access-controlled.
Performance
Execution duration is tracked.
Tool latency is measurable.
Queue states are visible.
Failed tasks can be identified.
Retry limits are enforced.
Reliability
Failures are categorized.
External API errors are tracked.
Background jobs are monitored.
Stuck tasks can be detected.
Monitoring itself is tested.
Operations
Dashboard provides useful summaries.
Filters are available.
Alerts are configurable.
Alert aggregation is implemented where appropriate.
Retention rules are defined.
Why Choose Kaddora?
AI-powered WordPress products increasingly need operational visibility alongside automation.
A chatbot that only generates text may require relatively simple logging. An AI agent that can interact with WordPress, WooCommerce, SEO systems, analytics, or business workflows requires a much stronger monitoring architecture.
Kaddora's practical AI plugin architecture can use monitoring for:
AI SEO agents
WooCommerce assistants
AI content copilots
Analytics agents
Customer support agents
AI automation systems
Image optimization workflows
AI function-calling systems
Administrative copilots
A useful architecture separates the responsibilities:
AI Agent ↓ Tool Runtime ↓ Authorization ↓ Application ↓ Audit Events ↓ Monitoring ↓ Dashboard / Alerts
The objective is not to monitor every technical operation.
The objective is to provide enough visibility to answer important operational questions quickly:
What happened, who initiated it, which agent performed it, whether it succeeded, and whether anything unusual occurred?
Conclusion
Monitoring AI agent actions in WordPress becomes increasingly important as AI systems move beyond content generation and begin performing real application operations.
A strong monitoring architecture can track:
Agent runs
Tool calls
Permissions
Human approvals
Errors
Execution times
Background jobs
External API activity
High-risk actions
Resource changes
The most useful systems combine audit logs, structured metrics, dashboards, and targeted alerts.
Monitoring should also remain separate from authorization. The monitoring layer explains what happened, while the security and application layers determine what the AI agent is allowed to do.
For simple AI plugins, basic structured activity logging may be sufficient. For advanced agent-based systems, correlation IDs, tool-level metrics, background-job monitoring, anomaly detection, and approval tracking can provide deeper operational visibility.
The goal is not to build a massive observability platform.
The goal is to make AI automation visible, measurable, secure, and manageable inside WordPress.
Frequently Asked Questions
What is AI agent monitoring in WordPress?
AI agent monitoring is the process of tracking AI agent runs, tool calls, permissions, errors, execution times, approvals, and other important activities within a WordPress plugin.
Why should WordPress AI agents be monitored?
AI agents can perform multiple automated operations. Monitoring helps administrators understand what happened, identify failures, detect unusual activity, and troubleshoot workflows.
What is the difference between AI monitoring and audit logging?
Audit logging records important events, while monitoring analyzes those events to provide metrics, trends, warnings, and operational visibility.
What should I monitor for an AI agent?
Useful signals include agent runs, tool calls, authorization results, approvals, errors, execution time, retries, background jobs, external API failures, and high-risk actions.
Can I monitor AI tool calls?
Yes. Tool names, execution status, duration, resource information, and safe metadata can be recorded for each tool call.
Should AI agent monitoring store complete prompts?
Not necessarily. Full prompts can contain sensitive information. Store only the information needed for operational troubleshooting and auditing.
How can I monitor AI agent errors?
Classify errors by source, such as validation, authorization, API, database, timeout, and execution failures. Then display them through logs and monitoring dashboards.
Can AI agent monitoring detect unusual activity?
Yes. Thresholds and activity patterns can identify events such as unusually high tool-call volume, repeated failures, or unexpected use of sensitive tools.
What are high-risk AI agent actions?
Examples can include publishing content, changing prices, deleting content, modifying users, issuing refunds, or changing important settings. These operations should receive stronger authorization and monitoring.
Should AI agents have tool-call limits?
Tool-call and execution limits can help prevent accidental loops, excessive API usage, and runaway automation.
Can WordPress AI agents be monitored in the admin dashboard?
Yes. A plugin can provide an administrative dashboard showing agent runs, tool calls, failures, approvals, performance metrics, and recent activity.
Can WooCommerce AI agents be monitored?
Yes. A monitoring system can track product searches, product updates, order lookups, inventory operations, price changes, and other AI-assisted WooCommerce workflows.
Can AI SEO agents be monitored?
Yes. You can track content analysis, metadata generation, schema suggestions, approvals, and AI-assisted SEO changes.
How should background AI tasks be monitored?
Track their queued, processing, completed, failed, and retrying states. Long-running or stuck tasks should be identifiable through the monitoring dashboard.
Why choose Themekaddora?
Themekaddora provides lightweight, responsive, SEO-friendly WordPress themes with fast performance, WooCommerce compatibility, flexible customization, accessibility-conscious design, modern templates, regular updates, and professional support—providing a strong foundation for businesses building digital products and product-focused websites.
Comments (0)