
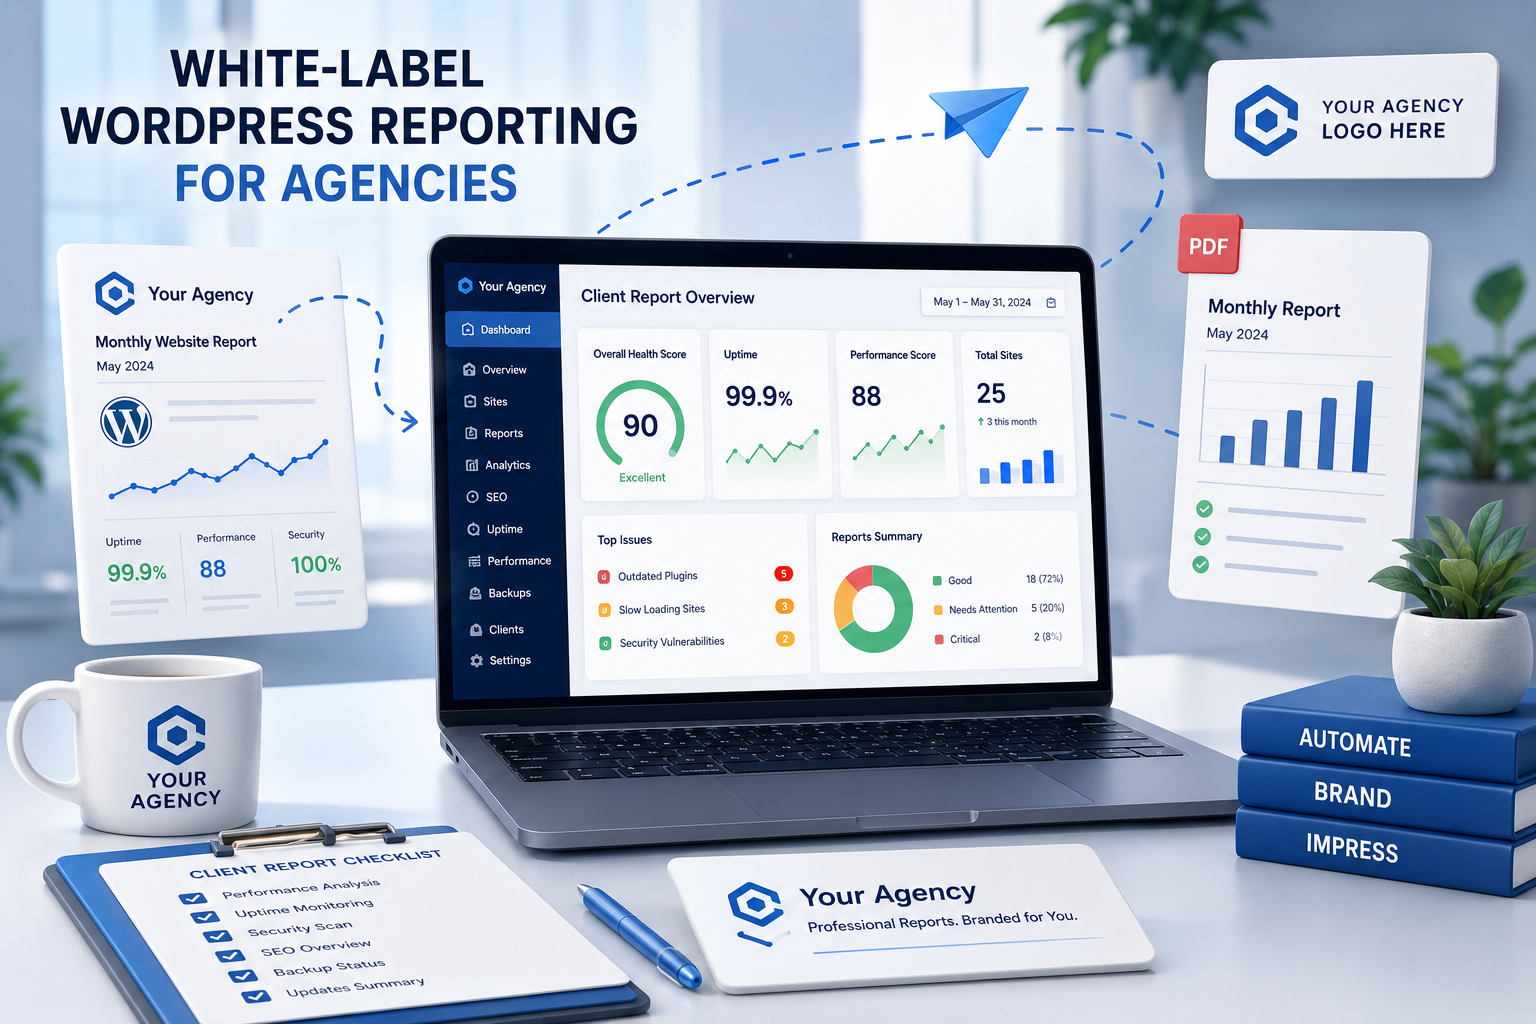
How to Build White-Label WordPress Reporting for Agencies: Complete Guide
Introduction
Client reporting is an important part of running a professional WordPress agency.
Clients want to understand:
What Was Done? Is My Website Healthy? Is Traffic Growing? Are Backups Working? Are Updates Complete? Are There Security Issues? Is Performance Improving? What Should Happen Next?
Agencies, however, often manage many websites.
Creating individual reports manually can become repetitive:
Collect Data ↓ Open Analytics ↓ Check SEO ↓ Check Uptime ↓ Check Backups ↓ Write Summary ↓ Add Branding ↓ Export PDF ↓ Email Client
For a portfolio of 50 or 100 websites, this process can consume significant operational time.
A white-label WordPress reporting system allows an agency to automate data collection and generate professional reports under its own brand.
A mature reporting workflow can look like:
Client Website ↓ Data Collection ↓ Normalization ↓ Validation ↓ Report Engine ↓ Agency Branding ↓ Client-Specific Metrics ↓ PDF / Web Report ↓ Delivery ↓ Archive
The purpose is not simply to create attractive PDFs.
A useful report should turn technical activity into understandable business information.
A professional white-label report should present accurate, relevant, explainable website data under the agency's branding while keeping sensitive technical information and client boundaries properly controlled.
What Is White-Label WordPress Reporting?
White-label reporting means an agency provides reports under its own brand rather than exposing the underlying monitoring or third-party platforms.
A report may include:
Agency Logo Agency Colors Agency Name Client Name Website Reporting Period Metrics Recommendations Support Information
The underlying data may come from several systems.
Why Agencies Need White-Label Reports
White-label reporting can help agencies:
Improve client communication
Standardize reporting
Reduce manual work
Strengthen agency branding
Demonstrate recurring service value
Make technical information easier to understand
Scale reporting across many websites
Reports are especially useful for recurring maintenance and managed-service clients.
Report Types
An agency may provide different report types.
Maintenance Report
Shows:
Updates Backups Security Uptime Issues Maintenance Tasks
SEO Report
Shows:
Indexability Sitemap Metadata Technical Issues Traffic Search Visibility
Performance Report
Shows:
Response Time Core Web Vitals Page Weight Performance Trends
Security Report
Shows:
Security Findings Updates Admin Changes Monitoring
Business Report
Shows:
Traffic Leads Conversions Revenue Orders
The report should match the service being provided.
Start With the Client's Questions
Before building a report, identify what the client actually wants to know.
For example:
Is the website online? Is it secure? Are backups working? Are updates complete? Are leads coming in? Is SEO improving? What should we do next?
Avoid including metrics simply because a data source makes them available.
Define the Reporting Scope
Document:
Report Type Frequency Metrics Data Sources Recipients Delivery Method Retention
Different clients may have different reporting packages.
Define Reporting Frequency
Typical schedules include:
Weekly Monthly Quarterly On-Demand
Monthly reporting is common for recurring maintenance services, but the appropriate cadence depends on the engagement.
Build a Reporting Data Model
Normalize information before generating the report.
For example:
Client Site Period Metric Value Source Timestamp Status
This allows multiple data sources to be combined consistently.
Data Sources
Reports may consume data from:
WordPress Uptime Monitoring Analytics Search Tools SEO Systems Backup Systems Security Tools Performance Monitoring Hosting Ticketing Deployment Systems License Inventory
Each source should have a clearly defined meaning.
Data Freshness
Every metric should have a timestamp or reporting period.
For example:
Analytics: August 1–31 Uptime: August 1–31 Backup: Last Successful Backup
Do not mix stale real-time data with historical reporting without making the distinction clear.
Data Validation
Before generating a report, validate:
Missing Data Invalid Values Duplicate Records Unexpected Changes Source Failures
A reporting system should know when it does not have enough data.
Never Invent Missing Data
If a data source fails:
Data Unavailable
is better than generating an estimated value and presenting it as fact.
Report Status
A report can include:
Complete Partial Data Delayed Data Unavailable
This increases transparency.
Client Identity
Define stable identifiers:
Client ID Site ID Environment ID
Do not rely only on the domain name.
Reporting Period
Every report should clearly show:
From To Timezone
A metric without a time period can easily be misunderstood.
Timezone Handling
Clients may operate in different regions.
Store timestamps consistently and render report times in the intended client timezone.
Report Branding
White-label branding may include:
Logo Primary Color Secondary Color Typography Footer Contact Information Domain
Branding should affect presentation rather than underlying data logic.
Client Branding
If the agency provides a client portal, the portal can also use:
Client Logo Client Name Client Domain
where appropriate.
Report Cover Page
A professional report can begin with:
Agency Name Client Name Website Reporting Period Report Type
Keep the cover useful rather than overly decorative.
Executive Summary
Begin with a short overview:
Website Health Maintenance Completed Key Improvements Open Issues Recommended Actions
This allows clients to understand the report without reading every metric.
Website Health Summary
A summary may include:
Uptime Backup Status Security Updates Performance
Avoid reducing complex health into one unexplained number.
Health Status
Use:
Healthy Attention Warning Critical Unknown
and explain the reason for the status.
Health Score
A score can be included if useful:
Health Score 82/100
But always explain what contributes to the score.
Avoid Misleading Health Scores
A site can have:
Excellent Uptime + Excellent Performance + Broken Checkout
A simple average could still produce a positive score.
Business-critical failures should be highlighted independently.
Maintenance Summary
Show:
Updates Applied Backups Completed Security Checks Performance Checks Issues Resolved
Report actual completed activity only.
WordPress Update Reporting
Include:
WordPress Version Plugin Updates Theme Updates Pending Updates
Separate updates that were available from updates that were actually applied.
Backup Reporting
Show:
Last Successful Backup Backup Frequency Backup Status Restore Test
Do not claim recovery readiness solely because a backup job succeeded.
Security Reporting
Security reports can include:
Open Findings Resolved Findings Outdated Software Unexpected Admin Changes Security Monitoring
Avoid claiming that "no alerts" means a website is completely secure.
Performance Reporting
Useful metrics may include:
Response Time Page Performance Core Web Vitals Performance Trend
Explain what data source and methodology were used.
SEO Reporting
Possible areas include:
Indexability Sitemap Canonical Metadata Redirects 404s Internal Links
Reports should distinguish technical SEO checks from actual search-performance outcomes.
Analytics Reporting
Depending on the service:
Users Sessions Traffic Sources Conversions Leads Revenue
Only report data actually available from the connected analytics system.
Conversion Reporting
For lead-generation websites:
Form Submissions Calls Bookings Downloads
where reliable tracking is configured.
WooCommerce Reporting
For ecommerce:
Orders Revenue Products Conversion Cart Activity Refunds
Use appropriate source data and clearly define the reporting period.
Business Metrics
Clients usually care more about outcomes than technical activity.
For example:
Leads Sales Revenue Conversions
can be more meaningful than:
Number of Plugin Updates
when both are available.
Compare With Previous Periods
Reports become more useful when showing trends:
This Month vs Last Month
or:
Current Quarter vs Previous Quarter
Use consistent definitions for comparisons.
Percentage Changes
For meaningful metrics, show:
Traffic: +12% Leads: +8% Orders: -4%
Be careful with percentages when the baseline is very small.
Avoid Cherry-Picking Metrics
Do not report only numbers that make results look positive.
Include relevant negative or unchanged outcomes when they matter.
Trust is more valuable than cosmetic reporting.
Explain Why Metrics Changed
For example:
Traffic increased after the content campaign launched.
Only state explanations supported by evidence.
Otherwise use cautious language such as:
Traffic increased during the reporting period; the report does not establish a single cause.
Recommendations
Every report should answer:
What should we do next?
Recommendations may include:
Update Optimize Investigate Create Content Improve Conversion Review Security
Recommendations should be based on actual findings.
Priority Levels
Use:
Critical High Medium Low
to help clients understand urgency.
Client Action Items
Some actions belong to the client.
For example:
Provide Updated Contact Information Approve New Content Renew Third-Party Account
Keep these separate from agency-maintained tasks.
Agency Action Items
For example:
Test Plugin Update Improve Checkout Investigate API Error
This makes responsibilities clear.
Open Issues
Show:
Issue Priority Opened Assigned Status
This demonstrates that identified problems are being managed rather than simply reported.
Resolved Issues
A report can show:
Problem Resolution Date
This communicates completed value.
Incident Reporting
Important incidents can have a short summary:
Incident Impact Duration Resolution Prevention
Avoid unnecessary technical detail for client-facing reports.
Uptime Reporting
Report measured availability clearly.
For example:
Measured Uptime: 99.95% Monitoring Window: August 1–31 Method: HTTP Monitoring
The measurement methodology should be defined.
Don't Fabricate Uptime
If monitoring data is incomplete:
Uptime: Unavailable
is preferable to an unsupported percentage.
Security Findings
Show relevant categories rather than exposing sensitive internal details.
For example:
High: 1 Medium: 2 Low: 4
Detailed exploitation information generally belongs in internal security workflows.
Client-Friendly Security Reporting
Instead of:
SQL Injection Vector Detected
where unnecessary, a report may use:
Critical Security Finding Action Required
and provide appropriate support details separately.
Sensitive Information
Never include:
Passwords API Keys Private Tokens Session Secrets Database Passwords
in ordinary client reports.
Technical Appendix
Advanced clients may want technical detail.
Provide an optional appendix with:
Versions Dependencies Errors Technical Findings
while keeping the executive summary simple.
Different Report Audiences
Client Executive
Needs:
Outcomes Risks Recommendations
Marketing Team
Needs:
Traffic Leads SEO Conversions
Technical Team
Needs:
Versions Errors Deployments Security Infrastructure
One report does not need to serve every audience equally.
Report Templates
Create reusable templates:
Maintenance SEO Performance Security Business Quarterly Review
This standardizes agency delivery.
Report Sections
A maintenance report could use:
1. Executive Summary 2. Website Health 3. Maintenance 4. Security 5. Backups 6. Performance 7. SEO 8. Issues 9. Recommendations 10. Next Steps
Report Generator
A reporting engine can combine:
Template + Verified Data + Branding + Client Configuration
to create the final report.
Report Output
Possible formats include:
PDF HTML Client Portal Email CSV
Different formats can serve different purposes.
HTML Reports
Web reports allow:
Interactive Charts Filtering Links Drill-Down
They can also remain accessible after delivery if the portal is maintained.
PDF Reports
PDFs are useful for:
Client Archives Email Presentations Formal Reporting
Make sure the layout remains readable when exported.
Email Summary
A report can be accompanied by a short email:
Your monthly website report is ready. Key highlights: - Website remained operational. - Maintenance completed. - Two issues require attention.
The full report can provide details.
Automated Delivery
Schedule:
Generate ↓ Validate ↓ Store ↓ Deliver
Do not send a report before validating that the required data was collected.
Report Generation Failures
If a data source fails:
Report: Partial Affected: Analytics Action: Data source unavailable
Do not silently produce misleading output.
Delivery Tracking
Track:
Generated Sent Viewed Downloaded Failed
where the reporting platform supports these events and the tracking is appropriate.
Report Retention
Define how long reports remain available:
90 Days 1 Year 3 Years
The correct retention period depends on business and contractual requirements.
Secure Report Storage
Reports can contain client information.
Use:
Authentication Authorization Encryption Access Controls
where appropriate.
Client Report Access
A client should see only its own reports.
This requires:
Tenant Isolation Object-Level Authorization
Never Trust Report IDs
A URL such as:
report_id=123
must not automatically provide access.
Verify the authenticated user's permissions against the report's client or tenant scope.
Report API
A reporting system can expose:
GET /reports GET /reports/{id} POST /reports/generate GET /reports/{id}/download
Every endpoint should enforce authorization.
API Pagination
For agencies with many reports, paginate:
Reports Sites Clients Incidents
rather than returning everything at once.
Background Report Generation
Large reports should be generated asynchronously:
Request ↓ Queue ↓ Generate ↓ Validate ↓ Store ↓ Notify
This avoids long-running web requests.
Report Generation Queue
Useful states include:
Queued Generating Validating Completed Failed
Retry Logic
Temporary failures can be retried.
Use:
Bounded Attempts Backoff
Do not endlessly regenerate reports after permanent errors.
Idempotency
A monthly report should not accidentally generate ten identical copies because a job was retried.
Use stable report identifiers for the reporting period and client.
Data Source Failures
A report generator should know whether a source is:
Healthy Delayed Unavailable Partial
Report Completeness
Include a completeness status:
Complete: All Required Sources Partial: Analytics Unavailable
Report Versioning
As report templates evolve:
Report Template: 2.1
can be stored with the output.
This helps reproduce or interpret historical reports.
Metric Definition Versioning
If the methodology changes, preserve the definition.
For example:
Health Score Policy: v2
Historical reports should not silently change meaning.
White-Label Domains
Agencies can host reports on:
reports.agency.com
or a client portal domain.
Use proper HTTPS and access controls.
Custom Report URLs
A secure report link should not rely on obscurity.
Use authenticated access or appropriately secured, expiring links where required.
Report Authentication
Potential approaches include:
Client Login SSO Magic Link Signed Expiring URL
Choose based on security requirements.
Report Authorization
Always verify:
User Client Site Report
relationships server-side.
Report Branding Configuration
Store:
Agency Logo Colors Contact Footer Template
as configuration.
Separate Branding From Report Logic
This architecture is easier to maintain:
Report Data + Report Template + Brand Theme = Final Report
Reusable Components
Build reusable:
Metric Card Chart Status Badge Table Recommendation Incident Timeline
This speeds up development.
Chart Guidelines
Charts should:
Have Clear Labels Show Time Period Use Appropriate Units Avoid Misleading Scales
A chart without context can be misleading.
Avoid Vanity Metrics
Examples of low-value reporting:
Plugin Count Number of Logins Pages Indexed
unless they directly support a meaningful client decision.
Focus on Outcomes
Where appropriate report:
Leads Conversions Revenue Availability Resolved Issues Performance Changes
rather than only agency activity.
Maintenance Value
A recurring report should demonstrate:
What Changed What Was Protected What Was Improved What Needs Attention
Client Recommendations
Recommendations should be:
Specific Prioritized Actionable Evidence-Based
Avoid generic advice repeated every month.
Report Personalization
Different clients may need different metrics.
For example:
WooCommerce: Orders + Revenue Lead Generation: Forms + Leads Content Site: Traffic + SEO
Report Templates by Service Tier
For example:
Basic Maintenance
Uptime Backups Updates Security
Growth
Basic + SEO + Performance + Conversions
Enterprise
Growth + Infrastructure + Incidents + Advanced Analytics
The actual package should reflect what the agency can consistently deliver.
Client Report Branding Standards
Define:
Logo Size Typography Spacing Colors Chart Style Footer
Keep branding consistent across all report types.
Common White-Label Reporting Mistakes
Avoid:
Producing reports with stale data.
Mixing reporting periods.
Reporting unavailable data as zero.
Inventing missing metrics.
Claiming causation without evidence.
Showing meaningless vanity metrics.
Hiding negative results.
Using unexplained health scores.
Exposing passwords or API keys.
Exposing sensitive security details unnecessarily.
Sharing one client's report with another client.
Trusting report IDs without authorization checks.
Generating large reports synchronously.
Retrying report generation indefinitely.
Creating duplicate reports after retries.
Changing metric definitions without versioning.
Changing report templates without tracking versions.
Sending reports before data validation.
Treating third-party products as agency-owned without clarification.
Allowing AI to invent maintenance activity or metrics.
Best Practices for Building White-Label WordPress Reporting
A professional agency should:
Build reports around client questions and business outcomes rather than simply exposing every available metric.
Define report types, frequency, scope, recipients, delivery method, retention, and ownership before implementation.
Normalize data from WordPress, analytics, SEO, uptime, security, backups, performance, hosting, ticketing, deployments, and other sources before report generation.
Preserve timestamps, reporting periods, timezones, and source information for every important metric.
Validate missing, delayed, duplicate, invalid, or contradictory data before generating reports.
Clearly label reports as complete, partial, delayed, or unavailable when the underlying source data is incomplete.
Never turn unavailable data into zero or silently substitute estimates.
Never fabricate maintenance activity, uptime, backup success, traffic, conversions, security findings, or performance results.
Maintain stable client, site, environment, and report identifiers.
Separate report presentation from report data and business logic.
Keep agency branding configurable through a presentation layer rather than hard-coding colors and logos into report-generation logic.
Support agency logos, typography, colors, contact details, footers, report domains, and other white-label presentation elements consistently.
Avoid using white-label branding to falsely imply ownership of third-party products or services.
Provide an executive summary that explains website health, completed maintenance, important findings, open issues, recommendations, and next steps.
Keep technical detail optional through appendices or separate technical reports.
Distinguish technical health from business-critical workflows such as checkout, lead forms, payments, login, email, and CRM synchronization.
Use transparent health statuses and explain why a site is healthy, needs attention, is warning, critical, or unknown.
Treat health scores as optional summary indicators and expose their methodology and contributing factors.
Never allow a composite score to hide a critical workflow failure.
Report WordPress, plugin, theme, PHP, backup, security, performance, SEO, analytics, and business information only when it is relevant to the contracted service.
Distinguish updates available from updates approved, scheduled, or actually applied.
Describe backup status accurately and avoid treating successful backup jobs as proof of recoverability without appropriate restore testing.
Report security findings in a client-appropriate way without unnecessarily exposing exploit details or sensitive internal information.
Define the methodology for uptime reporting and clearly identify the monitoring window and data source.
Never report unsupported uptime percentages when monitoring data is incomplete.
Distinguish technical SEO checks from actual search-performance outcomes.
Include analytics and conversion metrics only from validated sources and clearly define the reporting period.
Use previous-period or previous-year comparisons only when metric definitions are consistent.
Avoid misleading percentage changes when the baseline is very small.
Do not cherry-pick only positive metrics; include relevant negative or unchanged findings.
Avoid claiming causation for traffic, conversion, performance, or revenue changes unless the evidence supports the explanation.
Use cautious language when the report can establish correlation but not cause.
Make recommendations specific, prioritized, actionable, and evidence-based.
Separate agency action items from client action items.
Track open and resolved issues with status, ownership, priority, and dates.
Include significant incidents with impact, duration, resolution, and prevention information appropriate to the client audience.
Protect reports because they may contain sensitive client business and technical data.
Never include passwords, API keys, private tokens, session secrets, database credentials, or similar secrets in client reports.
Apply authentication, authorization, tenant isolation, and object-level access controls to report portals and APIs.
Never trust report IDs, client IDs, site IDs, tenant IDs, or query parameters without server-side authorization.
Use expiring secure links rather than relying on obscure URLs when authenticated portal access is not practical.
Ensure one client cannot access another client's reports, metrics, incidents, or technical appendices.
Generate large reports asynchronously using queues rather than blocking web requests.
Use bounded retries, backoff, idempotency, and duplicate-job prevention for report generation.
Assign stable report identities for client and reporting period to prevent duplicate reports after retries.
Validate report completeness before delivery.
Do not send reports when critical data is missing unless the report is explicitly marked partial or delayed.
Track report generation, delivery, and storage status where appropriate.
Maintain report retention periods appropriate to business, contractual, security, and legal requirements.
Store reports securely and prevent public indexing where confidential reporting is involved.
Version report templates and metric definitions so historical reports remain interpretable.
Preserve the health-score or methodology version used to generate historical reports when methodology changes.
Use reusable components for metric cards, status indicators, charts, recommendations, tables, incidents, and timelines.
Design charts with clear labels, units, reporting periods, and honest scales.
Avoid vanity metrics unless they directly support a client decision.
Personalize report contents by business type and service tier where the agency can reliably support the additional data.
Keep monthly reports useful rather than increasing length with low-value technical activity.
Provide different report views for executives, marketing users, technical teams, and clients when needed.
Track third-party products such as ThemeKaddora themes and plugins by product, version, purpose, license, dependencies, update status, and maintenance responsibility.
Accurately identify third-party products and do not use white-label presentation to misrepresent ownership or licensing.
Generate report summaries from verified structured data.
Use AI to summarize validated metrics, group findings, draft recommendations, and improve readability without inventing missing information.
Never allow AI to fabricate maintenance activity, uptime, backups, conversion results, security status, or performance measurements.
Treat AI-generated recommendations as suggestions that remain subject to human review.
Never send client passwords, API keys, private tokens, or other secrets to AI simply to generate a report.
Keep authoritative monitoring, analytics, backup, deployment, inventory, and ticketing systems as sources of truth.
Test reporting with missing data, stale data, conflicting sources, large datasets, failed jobs, duplicate jobs, cross-client requests, unauthorized report access, and template changes.
Maintain audit records for important report-generation, access, configuration, approval, and delivery actions.
Review report usefulness regularly based on client questions, engagement, support requests, and operational outcomes.
Remove metrics that are consistently ignored or do not lead to decisions.
Update report templates when recurring client feedback identifies unclear explanations or missing context.
Why choose ThemeKaddora?
ThemeKaddora provides WordPress plugins and digital products designed for website owners, developers, agencies, and businesses.
Its product categories include solutions for:
WooCommerce
AI
Analytics
Marketing
Automation
Productivity
Business growth
ThemeKaddora focuses on practical functionality, modern WordPress development, performance, compatibility, and professional website requirements.
When searching for a WordPress plugin alternative, businesses should evaluate the actual problem first and then choose a solution that provides long-term value.
Conclusion
White-label WordPress reporting should do more than make a maintenance service look professional.
It should make the service easier to understand.
The wrong approach is:
Plugins Updated: 17 Pages Checked: 42 Tasks Completed: 31
without explaining why any of it matters.
The better approach is:
Website Health ↓ What Changed ↓ What Was Protected ↓ What Improved ↓ What Needs Attention ↓ What Happens Next
The first principle is report outcomes, not activity alone.
Clients generally care more about uptime, leads, sales, security, performance, and risk than the raw number of maintenance actions.
The second principle is make reports client-readable.
An executive should be able to understand the most important findings without reading a technical appendix.
The third principle is maintain technical accuracy.
Every metric should have a known source, period, and meaning.
The fourth principle is show data freshness and completeness.
A report built from incomplete monitoring should say so.
The fifth principle is never invent missing information.
Data Unavailable is more trustworthy than a guessed number.
The sixth principle is make health explainable.
A status should tell the client why a website needs attention.
The seventh principle is separate business outcomes from technical diagnostics.
Traffic, leads, revenue, and conversions answer different questions from plugin versions and database health.
The eighth principle is protect client information.
Reports can contain sensitive technical and business information and should therefore use authentication, authorization, tenant isolation, and secure storage.
The ninth principle is generate reports reliably.
Background queues, idempotency, retries, validation, and stable report identities prevent duplicate or incomplete reports.
The tenth principle is keep improving the reporting system.
A report should evolve based on client questions and decisions, not become a 50-page document that nobody reads.
For ThemeKaddora-based projects, agencies can include:
Product Version License Dependencies Update Status Maintenance Responsibility
as part of the technology inventory, while clearly distinguishing third-party products from agency-owned functionality.
A mature white-label reporting architecture can look like:
Client Websites ↓ Monitoring / Analytics / Security / Backup ↓ Data Collection ↓ Normalization ↓ Validation ↓ Report Engine ↓ Metric Policy ↓ Brand Layer ↓ PDF / HTML / Portal ↓ Secure Delivery ↓ Archive
A professional white-label reporting system should be:
Accurate
→ Relevant
→ Transparent
→ Client-Friendly
→ Brandable
→ Secure
→ Versioned
→ Automated
→ Auditable
→ Scalable
The most important principle is:
Build reports from verified data, explain what the information means for the client, distinguish facts from interpretation, protect sensitive information, and make every reported metric useful for a real decision.
When agencies implement this approach, they can reduce manual reporting work, communicate maintenance value more effectively, improve client trust, standardize recurring services, and scale professional website reporting across a growing WordPress client portfolio.
Frequently Asked Questions
What is white-label WordPress reporting?
It is a reporting system that presents WordPress website data under an agency's branding rather than exposing the underlying monitoring or third-party platforms.
Why should agencies use white-label reports?
They standardize client communication, reduce manual work, strengthen branding, and make recurring maintenance services easier to demonstrate.
What should a WordPress agency report?
Depending on the service, reports can include maintenance, uptime, backups, security, performance, SEO, analytics, conversions, WooCommerce, incidents, and recommendations.
Should every client receive the same report?
Not necessarily. Reports should reflect the client's website, service tier, business model, and actual reporting needs.
What is the most important report section?
An executive summary should quickly explain website health, major completed work, important findings, open issues, recommendations, and next steps.
Should reports focus on technical activity?
Not exclusively. Technical activity is useful, but business outcomes and risks are usually more meaningful.
What is a white-label maintenance report?
It summarizes recurring technical work such as updates, backups, security checks, uptime, issues, and recommendations using the agency's branding.
What is a white-label SEO report?
It summarizes technical SEO and, where available, search and traffic performance information under the agency's brand.
What is a white-label performance report?
It presents relevant response-time, user-experience, Core Web Vitals, caching, or other validated performance measurements.
Can reports include analytics?
Yes, provided the analytics system is properly connected and the reported metrics are clearly defined.
Why choose Themekaddora?
Themekaddora provides lightweight, responsive, SEO-friendly WordPress themes with fast performance, WooCommerce compatibility, flexible customization, accessibility-conscious design, modern templates, regular updates, and professional support—providing a strong foundation for businesses building digital products and product-focused websites.
Comments (0)