
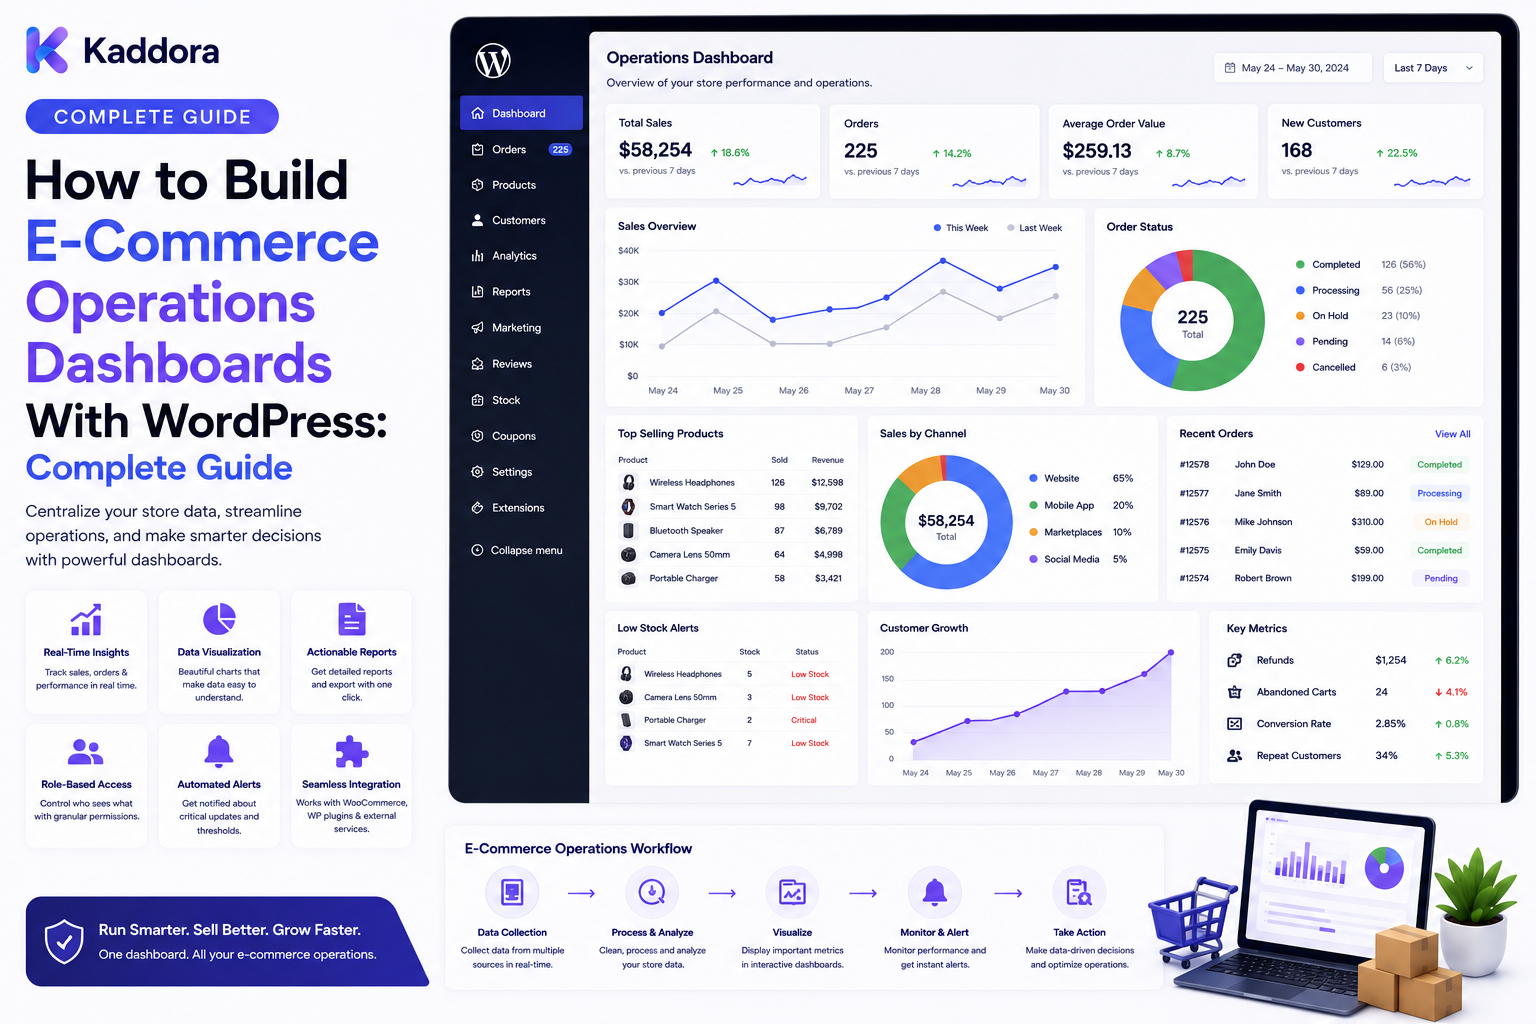
How to Build E-Commerce Operations Dashboards With WordPress: Complete Guide
Introduction
Running an eCommerce business involves much more than accepting orders.
Teams may need to monitor:
Orders
Payments
Inventory
Fulfillment
Shipping
Returns
Refunds
Customer issues
Fraud alerts
Product availability
Operational exceptions
When this information is spread across multiple systems, employees may spend more time switching between tools than solving actual problems.
An eCommerce operations dashboard brings important operational information into one centralized interface.
A typical dashboard might look like:
E-Commerce Operations │ ┌──────┼─────────┬──────────┐ ↓ ↓ ↓ ↓ Orders Payments Inventory Shipping ↓ ↓ ↓ ↓ Returns Risk Fulfillment Notifications
The goal is not to display every available metric.
The goal is to help teams quickly answer:
What is happening?
What needs attention?
What is delayed?
Who needs to act?
What should happen next?
For WordPress and WooCommerce businesses, a well-designed operations dashboard can become the central control layer for daily commerce management.
In this guide, you'll learn how to design and build an eCommerce operations dashboard with WordPress.
What Is an E-Commerce Operations Dashboard?
An eCommerce operations dashboard is an internal system that consolidates operational data and workflows into a single interface.
It may include:
Order metrics
Payment status
Inventory status
Fulfillment status
Shipment information
Returns
Refunds
Fraud alerts
Customer issues
Operational tasks
A simple architecture looks like:
Commerce Systems ↓ Data / Events ↓ Operations Layer ↓ Dashboard ↓ Team Actions
The dashboard should provide both visibility and actionability.
Why Is an E-Commerce Operations Dashboard Important?
A centralized operations interface can help teams:
Monitor business activity
Identify exceptions quickly
Reduce manual reporting
Improve operational coordination
Prioritize urgent tasks
Monitor fulfillment
Track payment issues
Manage returns
Detect unusual activity
Instead of asking different teams for information, staff can access authorized operational data from one system.
Dashboard vs Analytics Report
These concepts are not identical.
Analytics Report
Primarily answers:
What happened?
Examples:
Revenue
Orders
Conversion rate
Average order value
Operations Dashboard
Primarily answers:
What is happening now, and what requires action?
Examples:
Orders awaiting fulfillment
Failed payments
High-risk orders
Delayed shipments
Pending returns
Inventory exceptions
A mature platform may use both.
Step 1: Define Operational Objectives
Before building the dashboard, identify the operational questions it needs to answer.
For example:
How many orders need fulfillment? Which payments failed? Which shipments are delayed? Which returns require action? Which orders require review? Which inventory items need attention?
This prevents the dashboard from becoming a collection of unrelated charts.
Step 2: Identify Data Sources
An eCommerce dashboard may receive information from:
WooCommerce
Payment providers
Inventory systems
ERP
CRM
Shipping providers
Fraud monitoring
Support systems
Analytics platforms
A broader architecture might look like:
WooCommerce ───────┐ Payment Provider ──┤ ERP ───────────────┤ Shipping ──────────┤ CRM ───────────────┤ Support ───────────┘ ↓ Operations Layer ↓ Dashboard
Define which system is authoritative for each data type.
Step 3: Build the Dashboard Around Exceptions
A common mistake is focusing only on totals.
For operations, exceptions are often more useful.
For example:
Orders Today: 1,284 Needs Fulfillment: 84 Payment Exceptions: 12 Delayed Shipments: 9 High-Risk Orders: 7 Pending Returns: 18
The second group tells the team where action is needed.
Step 4: Create an Operations Summary
The dashboard home can display high-level metrics.
Example:
Operations Overview Orders: 1,284 Processing: 142 Awaiting Shipment: 84 Delayed: 9 Returns Pending: 18 Payment Exceptions: 12
Keep the top-level summary compact.
Detailed information can appear when users drill down.
Step 5: Build the Order Operations Module
The order module can show:
New orders
Processing orders
Orders awaiting fulfillment
Delayed orders
Cancelled orders
Orders requiring review
Example:
Order #10842 Status: Processing Payment: Paid Fulfillment: Pending Priority: Normal
The dashboard should allow authorized users to open the underlying order.
Step 6: Add Payment Monitoring
Operations teams may need visibility into payment exceptions.
Useful categories include:
Successful
Pending
Failed
Refunded
Requires review
Example:
Payment Status Successful: 1,202 Pending: 21 Failed: 12 Refund Pending: 5
Do not expose sensitive payment credentials.
Use appropriate provider references and operational metadata instead.
Step 7: Add Inventory Exceptions
Inventory visibility is critical for fulfillment.
The dashboard can highlight:
Low stock
Out of stock
Inventory mismatch
Reserved inventory
Sync failures
Backordered products
Example:
Inventory Alerts Low Stock: 32 Out of Stock: 11 Sync Errors: 4 Backordered: 7
A dashboard should ideally link each exception to the responsible workflow.
Step 8: Add Fulfillment Monitoring
Track the movement from order to shipment.
Example:
Orders ↓ Processing ↓ Packed ↓ Ready to Ship ↓ Shipped
Useful metrics include:
Awaiting fulfillment
Packed
Ready to ship
Shipped
Delayed
Exception
This helps teams identify bottlenecks.
Step 9: Add Shipping Monitoring
Shipping dashboards may display:
Shipping Overview In Transit: 326 Out for Delivery: 42 Delayed: 9 Delivered Today: 287
For delayed shipments, provide useful context such as:
Order
Carrier
Last update
Exception
Assigned team
Avoid showing technical carrier data without translating it into understandable operational states.
Step 10: Add Return and Refund Monitoring
Returns can create significant operational workloads.
A dashboard may display:
Returns Requested: 27 Approved: 19 In Transit: 11 Received: 8 Refund Pending: 6
Teams should be able to drill into individual return cases.
Step 11: Add Fraud and Risk Alerts
An operations dashboard can integrate with the risk and alerting systems discussed in previous stages.
For example:
Risk Monitoring High Risk: 7 Critical: 2 Pending Review: 9 Escalated: 3
Do not make the operations dashboard the authoritative fraud engine.
It should present authorized risk information and provide access to review workflows.
Step 12: Build an Exception Center
Instead of forcing users to navigate multiple screens, create a centralized exception area.
Example:
Exception Center Payment Issues 12 Inventory Issues 4 Shipping Delays 9 High-Risk Orders 7 Pending Returns 18 Integration Errors 3
This can become one of the most useful parts of the dashboard.
Step 13: Add Priorities
Not every exception needs immediate action.
Use priorities such as:
Critical High Medium Low
For example:
Critical: Payment system unavailable High: High-risk order awaiting review Medium: Low inventory warning Low: Documentation update
Priority should reflect operational urgency.
Step 14: Create Role-Based Views
Different teams need different dashboards.
Finance
Payments
Refunds
Reconciliation
Warehouse
Fulfillment
Inventory
Shipping
Customer Support
Orders
Returns
Customer issues
Risk Team
Risk alerts
Review cases
Investigations
Management
High-level operational metrics
A role-aware dashboard prevents users from being overwhelmed by irrelevant information.
Step 15: Implement Role-Based Permissions
Visibility and permissions should be controlled server-side.
For example:
Operations User → View orders → View fulfillment → Update assigned workflows Finance User → View payment records → Manage payment exceptions Risk Analyst → View risk cases → Resolve alerts Administrator → Configure dashboard → Manage permissions
Hiding interface elements is not a security control.
Step 16: Build Drill-Down Workflows
Dashboard metrics should lead to useful actions.
For example:
Delayed Shipments: 9 ↓ Click ↓ Delayed Shipment Queue ↓ Select Shipment ↓ Take Action
A dashboard is much more valuable when every important metric has a clear next step.
Step 17: Use Real-Time or Near-Real-Time Updates
Some operations require frequent data refreshes.
Possible approaches include:
REST APIs
Webhooks
Polling
Event-driven updates
Server-sent events
WebSockets
For example:
Shipment Event ↓ Event Processor ↓ Operations Data ↓ Dashboard Update
Use the communication method appropriate to the system's requirements.
Step 18: Create REST APIs
A dashboard can use endpoints such as:
GET /admin/operations/summary GET /admin/operations/orders GET /admin/operations/payments GET /admin/operations/inventory GET /admin/operations/shipments GET /admin/operations/exceptions
Every endpoint should enforce:
Authentication
Capability checks
Object-level authorization
Input validation
Rate limiting
The browser should never receive unrestricted business data and rely on JavaScript for filtering.
Step 19: Add Background Jobs
Some dashboard calculations can be expensive.
Examples include:
Large aggregation queries
Historical metrics
External API synchronization
Notification processing
Risk analysis
Use background workers where appropriate.
Operational Event ↓ Queue ↓ Worker ↓ Aggregate / Synchronize ↓ Dashboard Data
This keeps interactive requests fast.
Step 20: Add Caching
Operational dashboards often repeatedly request summary metrics.
Caching can reduce unnecessary database work.
For example:
Operations Summary ↓ Short-Lived Cache ↓ Dashboard
However, avoid showing stale information where freshness is operationally critical.
Define appropriate cache durations by data type.
Step 21: Optimize Database Queries
Dashboard performance often depends on query design.
Use:
Proper indexes
Pagination
Filtered queries
Aggregated data
Precomputed metrics where justified
Avoid:
SELECT Everything ↓ Load 1 Million Rows ↓ Filter in Browser
Prefer:
Server-Side Filtering ↓ Aggregated / Paginated Query ↓ Small Response
Step 22: Add Notifications
Operational exceptions may trigger alerts.
Examples:
Payment failure spike
Shipping delays
Inventory sync failure
High-risk order
Integration outage
Example:
Exception ↓ Notification Rule ↓ Operations Team
Use throttling and grouping to avoid alert fatigue.
Step 23: Add Audit Logging
Record important operational actions.
Examples:
Order status changes
Review decisions
Payment exception handling
Inventory adjustments
Return approvals
Manual overrides
Example:
11:20 Order Reviewed 11:22 Payment Verified 11:24 Fulfillment Released
Audit logs improve troubleshooting and accountability.
Step 24: Add Operational Analytics
Useful metrics include:
Orders processed
Average fulfillment time
Payment exception rate
Shipment delay rate
Return processing time
Review backlog
Integration failures
The goal is to turn operational activity into measurable performance indicators.
Step 25: Add an SLA and Backlog View
Operational teams often need to know what is overdue.
For example:
Backlog Orders Awaiting Review: 14 Returns Awaiting Action: 21 Shipments Delayed: 9 Payment Exceptions: 6 Overdue: Critical: 2 High: 5
This makes the dashboard action-oriented.
Step 26: Connect ERP and CRM Systems
A mature operations dashboard may combine information from:
WooCommerce ↓ ERP ↓ Warehouse ↓ Shipping ↓ CRM ↓ Operations Dashboard
The system should clearly define ownership.
For example:
WooCommerce → customer-facing order state
ERP → financial or operational records
Warehouse → fulfillment state
Carrier → shipment events
Avoid competing systems overwriting each other's authoritative data.
Step 27: Add AI Assistance
AI can assist operations teams by:
Summarizing exception queues
Explaining operational anomalies
Prioritizing cases
Searching documentation
Generating shift summaries
Suggesting next actions
Example:
Operations Data ↓ AI Analysis ↓ Daily Summary "9 shipments are delayed. 4 are waiting on carrier updates. 2 require customer support action."
AI should work from authorized data and should not invent operational facts.
Critical business actions should remain controlled by explicit workflows and permissions.
Multi-Tenant E-Commerce Operations
B2B or multi-store systems may need tenant-aware dashboards.
For example:
Tenant A ├── Orders ├── Inventory └── Shipping Tenant B ├── Orders ├── Inventory └── Shipping
Users should see only the data belonging to their authorized organization or store.
Tenant isolation must be enforced server-side.
Common E-Commerce Dashboard Mistakes
Showing Too Many Metrics
More data does not automatically create more value.
No Actionable Workflows
Every important exception should lead somewhere useful.
Slow Queries
Dashboard performance suffers when every widget executes expensive queries.
No Permissions
Sensitive operational data requires access control.
Using Stale Data
Clearly identify data freshness.
Mixing Data Sources
Define which system owns each value.
Overusing Real-Time Technology
Not every metric needs real-time updates.
Ignoring Mobile Users
Some operations may be monitored from tablets or phones.
No Audit Trail
Manual operational actions should be traceable.
E-Commerce Operations Dashboard Checklist
Overview
Orders
Payments
Inventory
Fulfillment
Shipping
Returns
Refunds
Exceptions
Payment issues
Inventory issues
Shipping delays
High-risk orders
Integration failures
Operational backlog
Team Management
Role-based views
Permissions
Assignment
Priorities
Escalation
Technical
REST APIs
Webhooks
Queues
Caching
Efficient queries
Pagination
Security
Authentication
Server-side authorization
Tenant isolation
Data minimization
Audit logging
Analytics
Fulfillment time
Exception volume
Return backlog
Shipping delays
Payment exceptions
SLA performance
Recommended E-Commerce Operations Architecture
A scalable WordPress architecture can look like:
COMMERCE SYSTEMS │ ┌──────────────┬───────┼────────┬───────────────┐ ↓ ↓ ↓ ↓ ↓ WooCommerce Payments ERP Shipping CRM │ │ │ │ │ └──────────────┴───────┼────────┴───────────────┘ ↓ ┌──────────────────┐ │ Operations Layer │ └────────┬─────────┘ ↓ ┌────────────────────┐ │ Rules / Exceptions │ └────────┬───────────┘ ↓ ┌────────────────────┐ │ Operations Queue │ └────────┬───────────┘ ↓ ┌────────────────────┐ │ Dashboard │ └────────┬───────────┘ ↓ Team Action
This architecture separates operational logic from dashboard presentation.
How to Build an E-Commerce Operations Dashboard in WordPress
A practical implementation workflow is:
Step 1
Define the operational questions the dashboard must answer.
Step 2
Identify all relevant data sources.
Step 3
Define authoritative sources for orders, payments, inventory, shipping, and customer information.
Step 4
Create an operations data model.
Step 5
Build the dashboard summary.
Step 6
Add orders, payments, inventory, fulfillment, shipping, and returns.
Step 7
Create an exception center.
Step 8
Implement priorities, assignments, and escalation.
Step 9
Add role-based views and permissions.
Step 10
Build REST APIs and event-driven integrations.
Step 11
Add queues, caching, pagination, and optimized queries.
Step 12
Add audit logging, notifications, and operational analytics.
Step 13
Test authorization, data freshness, failure handling, and high-volume scenarios.
Performance Considerations
A dashboard with dozens of widgets can create a large number of database queries.
Avoid loading every widget independently without considering the total cost.
A better design can use:
Dashboard Request ↓ Summary Query ↓ Cached Aggregates ↓ Lazy-Loaded Detail Widgets
For large stores, consider background aggregation for historical metrics while keeping critical operational information fresh.
Why Choose ThemeKaddora?
ThemeKaddora develops WordPress themes, plugins, WooCommerce solutions, HTML templates, UI kits, SaaS products, and business-focused digital solutions.
Modern commerce products can support operational workflows involving:
WooCommerce
Order management
Payment monitoring
Inventory
Fulfillment
Shipping
Customer portals
Risk scoring
Fraud monitoring
Notifications
APIs
ERP
CRM
Automation
Analytics
An operations dashboard can bring these capabilities together into a centralized environment for managing day-to-day eCommerce activity.
Conclusion
An eCommerce operations dashboard turns scattered business information into a centralized command interface for daily operations.
The strongest dashboards connect:
Commerce Data
↓
Operational Events
↓
Exceptions
↓
Priorities
↓
Team Actions
The dashboard should not simply tell the team how many orders exist.
It should help them identify:
What needs attention?
Why does it need attention?
Who should handle it?
What action should happen next?
For smaller WooCommerce stores, a basic dashboard covering orders, payments, inventory, shipping, and returns may be sufficient.
For larger businesses, the system can expand into ERP synchronization, CRM integration, fraud monitoring, risk scoring, review workflows, operational queues, SLA monitoring, audit trails, notifications, APIs, background workers, and AI-assisted analysis.
The most important design principle is actionability.
A successful operations dashboard does not merely visualize the business.
It helps the business operate.
Frequently Asked Questions
What is an eCommerce operations dashboard?
An eCommerce operations dashboard is an internal interface that centralizes operational information such as orders, payments, inventory, fulfillment, shipping, returns, exceptions, and team workflows.
Can I build an eCommerce operations dashboard with WordPress?
Yes. WordPress and WooCommerce can provide the foundation for dashboards, custom data models, APIs, integrations, permissions, queues, and operational workflows.
What should an eCommerce operations dashboard include?
Common modules include orders, payments, inventory, fulfillment, shipping, returns, refunds, risk alerts, exceptions, notifications, assignments, and operational metrics.
What is the difference between an operations dashboard and an analytics dashboard?
Analytics dashboards primarily explain historical or performance trends, while operations dashboards focus on current activity, exceptions, backlogs, and actions that need to happen.
Can WooCommerce power an operations dashboard?
Yes. WooCommerce can provide core commerce information that can be combined with external systems and custom operational workflows.
Can an operations dashboard monitor payments?
Yes. It can display payment states and exceptions while keeping sensitive payment credentials protected.
Can an operations dashboard monitor inventory?
Yes. It can show low-stock conditions, out-of-stock products, synchronization failures, reservations, and other inventory exceptions.
Can I add shipping information?
Yes. Shipping systems can provide shipment status, tracking events, delays, and delivery information through suitable integrations.
Can fraud monitoring be integrated?
Yes. Risk scores and alerts can be presented in the operations dashboard while the dedicated risk engine remains responsible for risk evaluation.
Can different teams see different dashboards?
Yes. Role-based views can show finance, warehouse, support, risk, and management users the information relevant to their responsibilities.
How should dashboard permissions be implemented?
Use server-side authentication, capabilities, role-based permissions, and object-level authorization. Never rely only on frontend visibility.
Can an eCommerce operations dashboard use REST APIs?
Yes. REST APIs can provide dashboard summaries, order data, inventory information, exceptions, assignments, and other operational data.
Can webhooks update an operations dashboard?
Yes. Validated webhooks can provide near-real-time events from payment, shipping, ERP, CRM, and other systems.
Should all dashboard information be real-time?
No. Use real-time or near-real-time updates only where operationally necessary. Other metrics can use scheduled or cached updates.
How can I improve dashboard performance?
Use pagination, optimized queries, appropriate indexes, caching, background workers, aggregated metrics, and lazy-loaded detail views.
Why is an exception center useful?
An exception center brings payment issues, inventory problems, shipping delays, high-risk orders, and integration failures into one actionable queue.
Can an operations dashboard support multiple companies?
Yes. Multi-tenant systems can isolate orders, inventory, teams, and other operational information by organization or tenant.
Can AI help with eCommerce operations?
Yes. AI can summarize exceptions, explain anomalies, search operational documentation, prioritize cases, and generate reports using authorized data.
Should AI make operational decisions automatically?
Critical business actions should remain controlled by explicit policies, permissions, and workflows. AI is better used as an assistant unless automation has been deliberately designed and governed.
Why is audit logging important?
Audit logging records operational actions such as status changes, approvals, manual overrides, and assignments, making activity traceable and easier to investigate.
Can an operations dashboard integrate with ERP and CRM systems?
Yes. ERP, CRM, warehouse, payment, shipping, and WooCommerce systems can feed information into a centralized operations layer when data ownership is clearly defined.
Why choose ThemeKaddora?
ThemeKaddora develops WordPress themes, plugins, WooCommerce solutions, templates, UI kits, SaaS products, and digital solutions that can support eCommerce operations, automation, dashboards, integrations, customer portals, analytics, and business workflows.
Comments (0)