
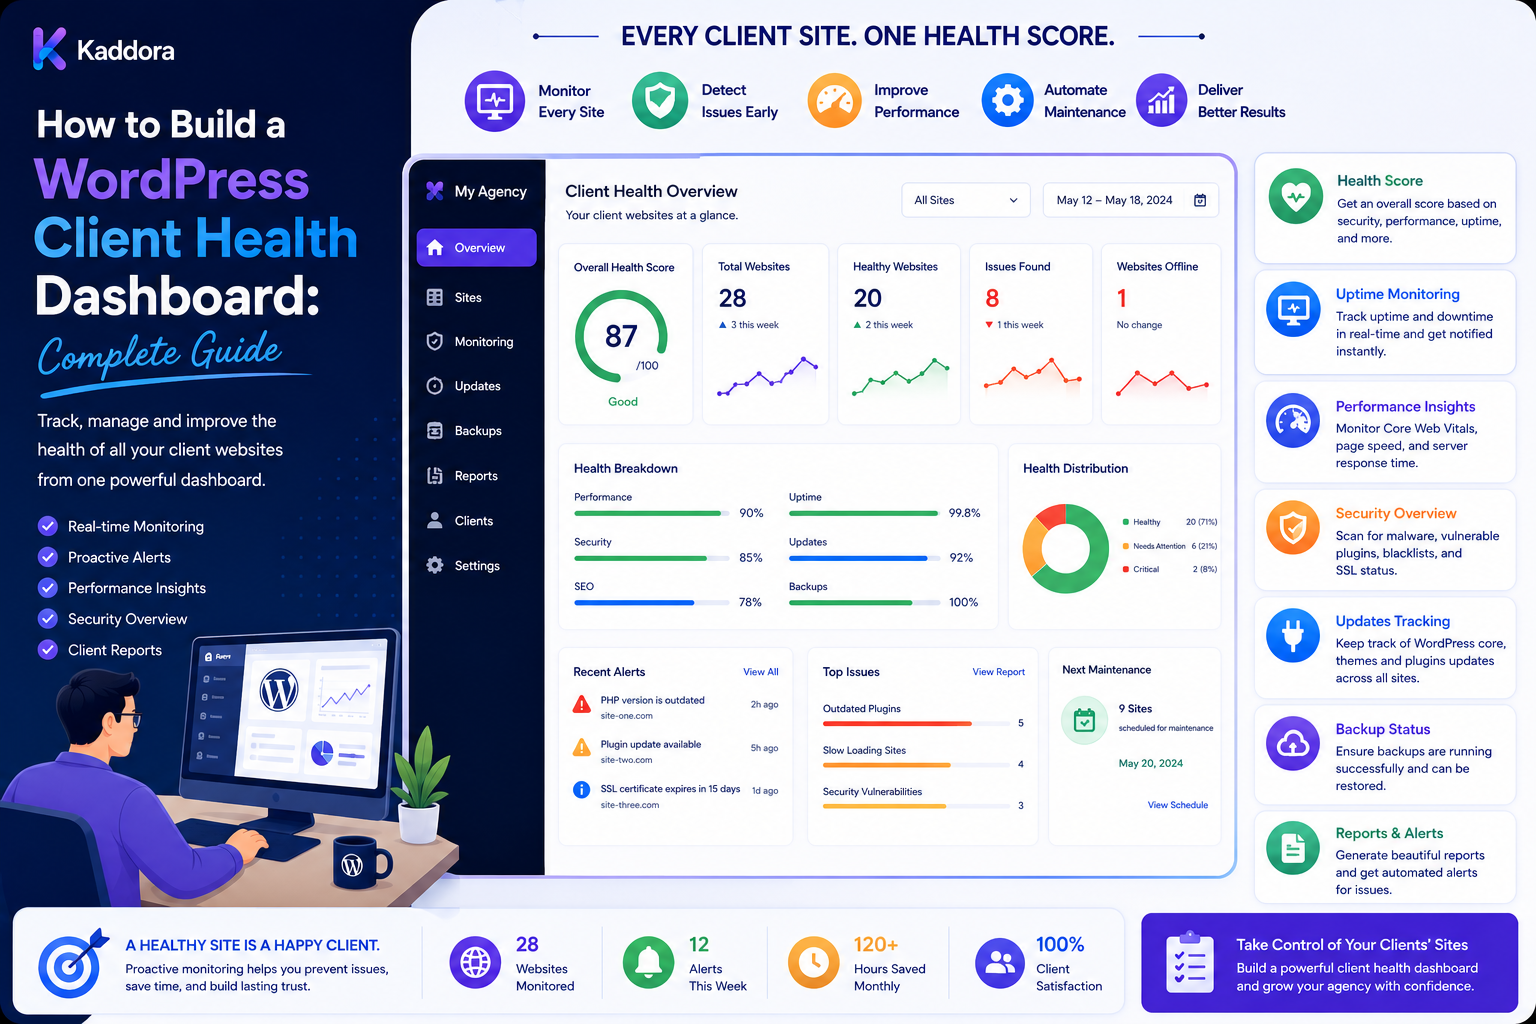
How to Build a WordPress Client Health Dashboard: Complete Guide
Introduction
When an agency manages several WordPress websites, checking every client site separately becomes increasingly inefficient.
A developer may need to visit:
Client A ↓ WordPress Admin Client B ↓ Hosting Panel Client C ↓ Analytics Client D ↓ Security Dashboard
This creates fragmented information.
A better approach is to build a centralized WordPress client health dashboard where the agency can see the operational condition of managed websites in one place.
Instead of asking:
Is the website working?
the dashboard should answer:
Is the site online? Are backups healthy? Are updates pending? Are there security issues? Is performance degrading? Is SSL valid? Are important integrations working? Are there errors? What requires attention?
A useful architecture can look like:
Client Websites ↓ Secure Monitoring Connectors ↓ Data Collection ↓ Normalization ↓ Health Engine ↓ Rules / Thresholds ↓ Health Score ↓ Dashboard ↓ Alerts / Tickets / Reports
The dashboard should not merely display data.
It should help the agency decide:
What Is Healthy? What Needs Attention? What Is Critical? What Should Happen Next?
The key principle is:
A client health dashboard should convert verified website, infrastructure, security, performance, and maintenance data into clear, actionable operational information without hiding uncertainty or giving AI uncontrolled authority.
What Is a WordPress Client Health Dashboard?
A client health dashboard is a centralized interface that summarizes the current and historical condition of client websites.
It can display:
Uptime SSL Backups Updates Security Performance Errors Database Forms Email APIs Queues Cron SEO Signals Licenses
The exact metrics should depend on the agency's maintenance service.
Why Agencies Need a Client Health Dashboard
A centralized dashboard can help agencies:
Monitor multiple websites
Prioritize problems
Reduce manual checks
Improve response times
Standardize maintenance
Track client health
Generate reports
Identify trends
Manage recurring services
It becomes particularly useful when the agency manages many websites.
Dashboard vs Monitoring System
These are related but different.
Monitoring System
Collects and detects signals.
Dashboard
Presents those signals in a useful interface.
For example:
Monitoring: Backup failed. Dashboard: Client X → Backup → Critical → Failed 6 hours ago → Action Required
The dashboard is the decision interface over the monitoring system.
Define Dashboard Goals First
Before designing the interface, determine what the dashboard should help users accomplish.
For example:
Find Critical Sites Review Maintenance Investigate Errors Check Backups Track Performance Prepare Client Reports
Do not add metrics simply because they are available.
Dashboard Users
Different users need different information.
Agency Executive
Needs:
Portfolio Health Open Risks SLA Status Client Trends
Operations Team
Needs:
Alerts Backups Versions Incidents Maintenance
Developer
Needs:
Errors Deployments Logs Versions APIs
Client
Usually needs:
Site Health Uptime Maintenance Reports Recommendations
Use role-based views instead of showing everyone every technical detail.
Client Portfolio Overview
The main dashboard can show:
Total Sites Healthy Attention Warning Critical Unknown
For example:
120 Sites Healthy: 94 Attention: 18 Warning: 6 Critical: 1 Unknown: 1
The exact values should come from actual monitoring data.
Site Health Status
Useful statuses include:
Healthy Attention Warning Critical Unknown
An Unknown status is important.
It means the system cannot confidently determine health.
Do not classify missing data as healthy.
Health Score
A dashboard can optionally use a composite health score.
Possible inputs:
Uptime Backup Updates Security SSL Performance Errors
For example:
Health Score: 92 / 100
But the calculation must be transparent.
A health score is a summary indicator, not an objective measure of overall website quality.
Weighted Health Score
Different metrics can have different importance.
For example:
Backup: 25% Security: 25% Uptime: 20% Performance: 15% Updates: 10% SSL: 5%
These weights are examples only.
An ecommerce site may reasonably use different priorities.
Avoid Misleading Scores
A site with excellent uptime but no recent backup should not necessarily appear "healthy."
Critical conditions should be able to override or cap a composite score.
Health Score Components
Break the score into visible categories:
Availability Security Backup Performance Software Application
This allows users to understand why a site received its score.
Availability Health
Track:
Uptime Response Time HTTP Errors DNS SSL
Security Health
Track relevant signals such as:
Security Alerts Unexpected Admins Outdated Components File Changes Authentication Events
Monitoring should complement a broader security program rather than claim complete protection.
Backup Health
Show:
Last Successful Backup Backup Age Backup Size Storage Last Restore Test
A site without a recent backup should require attention according to the agency's policy.
Software Health
Show:
WordPress Version PHP Version Theme Version Plugin Versions WooCommerce Version
Also distinguish:
Update Available
from:
Update Approved
Performance Health
Show useful indicators:
Response Time Page Performance Core Web Vitals Server Load Cache Health
Use historical context.
Application Health
A site can be online but broken.
Monitor:
Forms Search Login Checkout Payments Email APIs Cron Queues
according to the site's functionality.
Database Health
Potential indicators include:
Database Connectivity Growth Slow Queries Connection Errors
Do not turn database size alone into a health judgment.
API Health
For external integrations:
Provider Availability Latency Error Rate Authentication
Queue Health
For sites using background jobs:
Queue Depth Processing Time Failed Jobs Retries Dead-Letter Jobs
Cron Health
Show:
Last Run Next Run Failures Delayed Jobs
Form Health
For important forms:
Last Successful Test Last Failure Email Delivery CRM Delivery
Use safe synthetic tests where appropriate.
WooCommerce Health
For ecommerce clients:
Checkout Payments Orders Emails Scheduled Tasks
Use non-destructive monitoring and provider-supported testing methods.
License Health
Track:
Theme Licenses Plugin Licenses API Subscriptions Renewal Dates
A license nearing expiry is usually an attention item, not automatically a website outage.
Domain Health
Track:
Domain Expiration DNS SSL
This supports broader client operations.
Dashboard Data Freshness
Every metric should indicate when it was last updated.
For example:
Uptime: 2 minutes ago Backup: 4 hours ago Plugin Inventory: 1 day ago
Stale data should not look current.
Data Freshness Status
Use:
Fresh Delayed Stale Unavailable
This is especially important for health dashboards.
Unknown State
If the connector cannot report backup status:
Backup: Unknown
not:
Backup: Healthy
Uncertainty should be visible.
Dashboard Cards
Common cards include:
Overall Health Uptime Backups Security Updates Performance Errors Incidents
Avoid creating dozens of cards that overwhelm users.
Portfolio Table
A table can display:
Client
Site
Health
Uptime
Backup
Updates
Security
Performance
Client A
example.com
Healthy
99.99%
Good
Current
Good
Good
Client B
example.org
Warning
99.91%
Failed
4
Warning
Good
Client C
shop.example
Attention
99.98%
Good
2
Good
Attention
The displayed values should come from current monitoring data.
Filters
Useful filters include:
Client Health Risk Environment Hosting WooCommerce Maintenance Plan Open Incident
Search
Allow staff to quickly search:
Client Domain Site ID Incident Plugin
Sorting
Sort by:
Health Risk Last Check Uptime Backup Age Open Incidents
Drill-Down
Clicking a site should open detailed health information:
Portfolio ↓ Client ↓ Website ↓ Category ↓ Metric ↓ Evidence
Site Overview
The individual site page can show:
Website Status Health Score Last Check Open Incidents Recent Changes
Health Timeline
Display:
Event Time Severity Source Resolution
For example:
14:00 Deployment 14:05 5xx Increased 14:15 Issue Resolved
This gives useful operational context.
Incident Timeline
For a serious problem:
Detected ↓ Acknowledged ↓ Investigated ↓ Resolved ↓ Verified
Deployment Correlation
Show recent deployments near incidents:
Deploy: 10:00 Error Spike: 10:04
This is evidence for investigation, not proof of causation.
Maintenance Timeline
Track:
Updates Backups Security Reviews Deployments Incidents
Version Timeline
Show changes:
WordPress: 6.x → 6.y Plugin: 2.3 → 2.4
This helps troubleshoot regressions.
Plugin Inventory
For every site:
Plugin Current Version Approved Version Update Available License Status
Theme Inventory
Show:
Theme Version Child Theme License Status
PHP Compatibility
Display:
PHP: Current Policy: Supported Risk: Low
The actual status should be based on the agency's defined support matrix.
Environment Information
Show:
Production Staging Development
and associated health data separately.
Do not mix staging health with production health.
Staging Status
A useful indicator is:
Staging: Available
or:
Staging: Missing
depending on the agency's requirements.
Environment Drift
Show meaningful differences:
Staging: Plugin 2.5 Production: Plugin 2.4
The dashboard can flag this as drift.
Backup Dashboard
Across all clients:
Recent Old Failed Unknown
This helps operations prioritize recovery risks.
Security Dashboard
Show:
Critical High Medium Low
and affected clients.
Performance Dashboard
Show trends:
Response Time Core Web Vitals Server Errors
Avoid presenting performance scores without methodology.
Uptime Dashboard
Show:
Current Status 24h 7d 30d
Use clearly defined measurement methods.
Error Dashboard
Group errors:
Error Occurrences First Seen Last Seen Sites Affected
Multi-Site Error Detection
If 20 client sites report the same plugin error:
Common Error ↓ Affected Sites ↓ Potential Shared Cause
This is highly useful for agencies using the same products across multiple clients.
ThemeKaddora Product Monitoring
If agencies use the same ThemeKaddora plugin across multiple projects, a dashboard can identify:
Product Version Sites Affected Compatible Outdated Error Reports License Status
This helps detect portfolio-wide upgrade risks.
Client-Specific Dashboards
Clients should see only their own website information.
For example:
Client A → Client A Sites
not the agency's complete portfolio.
Client Portal
A dashboard can become part of a secure client portal containing:
Health Maintenance Reports Incidents Requests Licenses Approvals
Role-Based Access Control
Define permissions such as:
View Health View Incidents View Reports Approve Updates Manage Site Manage Users
Never give every dashboard user full administrative access.
Tenant Isolation
For SaaS systems:
Tenant A → Tenant A Sites Tenant B → Tenant B Sites
Every query must enforce tenant scope.
Never Trust Client-Supplied Tenant IDs
Resolve tenant identity server-side from authenticated context.
Do not trust a request parameter such as:
tenant_id=123
without authorization.
Dashboard API
Possible endpoints:
GET /sites GET /sites/{id}/health GET /sites/{id}/incidents GET /sites/{id}/versions GET /sites/{id}/backups GET /portfolio/summary
Sensitive endpoints need authentication and authorization.
API Pagination
Do not return thousands of sites in one response.
Use:
page per_page cursor
as appropriate.
API Filtering
Support filters such as:
health=critical risk=high environment=production
while enforcing server-side authorization.
API Caching
Portfolio summaries can sometimes be cached.
Cache keys must respect:
Tenant User Scope Filters Time Range
Cache Invalidation
Invalidate relevant dashboard caches when:
Health Changes Incident Changes Site Added Site Removed Permissions Change
Background Aggregation
A dashboard with hundreds of sites should not query every WordPress installation every time a user loads the page.
Use:
Scheduled Collection ↓ Normalize ↓ Store ↓ Aggregate ↓ Dashboard
Real-Time vs Periodic Data
Not every metric needs real-time collection.
For example:
Uptime: Near Real-Time Version Inventory: Daily License: Daily Monthly Report: Monthly
Choose freshness based on business value.
Dashboard Performance
A portfolio page should remain fast even with many client websites.
Use:
Pre-Aggregation Pagination Caching Background Jobs Indexed Tables
Avoid N+1 Queries
Do not load each site's metrics separately when one optimized query can retrieve the portfolio summary.
Database Schema
A central system may store:
clients sites environments health_checks health_snapshots incidents deployments versions backups licenses alerts
Keep historical records appropriately scoped.
Health Snapshot
A snapshot can represent:
Site Timestamp Availability Security Backup Performance Software Application Overall
This supports historical graphs.
Health History
Store trend data:
Daily Health Weekly Health Monthly Health
depending on reporting needs.
Health Score Versioning
If the formula changes, store the score methodology version.
For example:
Health Score: 92 Formula: v2
This prevents old and new scores from being compared incorrectly.
Evidence Behind Health Scores
Every important score should be explainable.
For example:
Security: 78 Reason: 2 outdated plugins 1 medium security finding
This is more useful than showing "78" alone.
Health Rules Engine
Rules can classify conditions:
IF backup_age > threshold THEN backup = warning
or:
IF uptime unavailable THEN availability = unknown
Rules should be configurable.
Critical Conditions
Some events deserve immediate attention:
Production Down Checkout Failure Backup Failure Critical Security Alert SSL Invalid
Rules should vary by client risk.
Alert Engine
The dashboard can create alerts when conditions are met:
Metric ↓ Rule ↓ Alert ↓ Incident / Ticket
Alert Deduplication
Repeated events should be grouped.
For example:
500 PHP Errors
could become:
1 Incident 500 Occurrences
Alert Suppression
During planned maintenance:
Maintenance Window ↓ Suppress Expected Alerts ↓ Resume
Use carefully.
Escalation
If a critical incident remains unresolved:
Developer ↓ Technical Lead ↓ Operations ↓ Client
according to service policy.
Dashboard Notifications
Use:
Email Slack Teams Dashboard
depending on urgency.
Avoid notifying everyone for every minor event.
Maintenance Recommendations
A dashboard can surface:
3 Updates Pending 1 Backup Failure SSL Expires Soon Performance Degradation
The recommendation should identify the evidence behind it.
Do Not Turn Recommendations Into Automatic Changes
A dashboard should normally recommend:
Update Plugin
rather than directly executing it unless the site's approved automation policy explicitly allows it.
AI-Assisted Health Analysis
AI can summarize structured data:
Client Site: Healthy with Attention Findings: 2 plugin updates Backup successful Response time increased No critical security alerts
AI Should Not Invent Health
AI should receive verified data from the monitoring system.
It should not estimate missing:
Uptime Backup Status Security Status Traffic
AI Root-Cause Hypotheses
AI can assist with:
Recent Deployment + Error Spike + Plugin Change = Possible Cause
This remains a hypothesis until verified.
AI Reporting
AI can draft:
Monthly Client Summary Maintenance Summary Incident Summary Recommended Actions
Use structured source data.
Human Review
Keep important decisions under controlled workflows:
Health Data ↓ AI Summary ↓ Human Review ↓ Client Report
Dashboard and Change Requests
A finding can become a maintenance task:
Health Finding ↓ Task ↓ Assignment ↓ Resolution
Dashboard and Support Desk
Integrate incidents with support tickets:
Incident → Ticket → Developer → Resolution
Dashboard and Monthly Reports
Generate reports from the same verified data shown internally.
This prevents inconsistent reporting.
Client-Facing Health Report
A client may receive:
Overall Health Uptime Backups Updates Security Performance Completed Maintenance Recommendations
Keep technical detail appropriate to the audience.
White-Label Dashboard
Agencies may want:
Agency Logo Agency Colors Custom Domain Custom Email
White-labeling should not compromise security or transparency.
White-Label Data Isolation
Each client's branded dashboard must still retrieve only authorized data.
Dashboard Export
Support:
PDF CSV Email
where useful.
Do not generate reports containing secrets or unnecessary personal information.
Dashboard Audit Logs
Track:
Login Health Viewed Report Generated Update Approved Incident Acknowledged
according to security requirements.
Dashboard Security
Protect:
Authentication Authorization Session Management API Access Secrets Tenant Isolation
Session Security
Use secure authentication and appropriate session protections.
Do not create a dashboard where one leaked session exposes every client website.
API Token Security
Store tokens securely and support:
Rotation Expiration Revocation
where appropriate.
Client Access Revocation
When a client leaves:
Revoke Portal Access ↓ Review Site Access ↓ Review Monitoring Credentials ↓ Archive Data
according to contract and retention requirements.
Data Retention
Define how long to keep:
Health Snapshots Alerts Incidents Logs Audit Events
Long-term data should have a defined business purpose.
Dashboard Backup
The central monitoring system also needs backups.
Protect:
Client Registry Health History Incidents Audit Logs Configuration
Disaster Recovery
Define:
Backup Restore Failover Recovery
for the dashboard itself.
Dashboard Monitoring
Monitor the monitoring platform.
Check:
Collector Health Queue Health Database API Scheduler Notification System
A broken dashboard should not silently appear healthy.
Monitoring Data Gaps
Track:
Last Check-In Last Successful Collector Run Last Data Update
This helps detect stale or missing data.
Unknown Is Not Healthy
This principle deserves emphasis.
If:
Monitoring: Unavailable
the dashboard should display:
Unknown
rather than:
Healthy
Portfolio Prioritization
Sort clients by:
Criticality Revenue Traffic SLA Security Risk Open Incidents
This helps operations teams focus.
Client Risk Profiles
For example:
Low: Simple Marketing Site Medium: Lead Generation High: WooCommerce / SaaS
Risk should determine monitoring and escalation policies.
SLA Monitoring
If the agency offers service-level agreements, track:
Response Time Incident Duration Availability
using the exact contractual definitions.
SLA Dashboard
Show:
Within SLA At Risk Breached Unknown
Do not claim compliance when data is incomplete.
Dashboard KPIs
Useful agency KPIs include:
Healthy Sites Critical Sites Open Incidents Backup Failures Update Backlog Average Detection Time Average Resolution Time False Positive Rate
Portfolio Trend Analysis
Track:
Health Over Time Incidents Performance Updates
This helps leadership identify recurring operational problems.
Common Portfolio Issues
A dashboard may reveal:
20 Sites: Outdated Plugin 15 Sites: Backup Problem 8 Sites: Slow Response
This can reveal a shared issue instead of treating every site separately.
Shared-Dependency Detection
If the same ThemeKaddora or third-party plugin is used across many sites, portfolio-wide findings can reveal:
Affected Product Affected Versions Affected Sites
This can help the agency investigate common risks faster.
Common Cause Investigation
A shared dependency does not automatically prove the cause.
Use:
Shared Dependency + Matching Error + Similar Timing
as evidence for further investigation.
Dashboard and Version Management
Connect versions to maintenance:
Outdated Plugin ↓ Affected Sites ↓ Risk ↓ Maintenance Task
Dashboard and Deployment Management
Connect deployments:
Release ↓ Sites ↓ Health ↓ Incidents
This improves release visibility.
Dashboard and Backup Management
Before major changes:
Check Backup ↓ Approved ↓ Deploy
The dashboard can confirm readiness.
Dashboard and Client Approvals
For selected maintenance actions:
Recommendation ↓ Client Approval ↓ Task ↓ Execution
Approval History
Track:
Who Approved What When For Which Site Which Version
This is useful for accountability.
Bulk Operations
Agencies may need to:
Select 50 Sites ↓ Review Updates ↓ Approve ↓ Queue
Bulk actions should have:
Preview Authorization Rate Limits Progress Failure Isolation
Bulk Operation Safety
Do not assume every selected site has identical:
Versions Configuration Dependencies Risk
Validate each site before execution.
Progress Tracking
Show:
50 Selected Completed: 32 Running: 8 Failed: 2 Pending: 8
Failure Isolation
One failed site should not stop every other approved task.
Rollback
For bulk maintenance:
Change ↓ Verification ↓ Failure ↓ Recover
Database changes require special caution.
Dashboard Mobile Support
Agency staff may need quick access on mobile.
Prioritize:
Critical Alerts Site Status Incidents Approvals
Don't attempt to reproduce every desktop feature on a small screen.
Accessibility
The dashboard itself should support:
Keyboard Navigation Screen Readers Focus Contrast Responsive Layout
The UI should be accessible to agency staff and clients.
Dashboard Design Principles
A good dashboard should be:
Simple Actionable Accurate Fast Transparent Role-Based Secure
Common Client Health Dashboard Mistakes
Avoid:
Showing too many metrics without prioritization.
Treating missing monitoring data as healthy.
Using opaque health scores.
Mixing production and staging health.
Displaying stale data without timestamps.
Giving every user unrestricted access.
Trusting client-supplied tenant IDs.
Exposing secrets in dashboards.
Creating thousands of duplicate alerts.
Treating one transient error as a major incident.
Using AI-generated guesses as authoritative health information.
Automatically changing production because a dashboard recommends it.
Running every site check synchronously when the portfolio is large.
Querying every client site every time the dashboard loads.
Ignoring data retention.
Failing to monitor the monitoring platform itself.
Ignoring failed collectors or stale site check-ins.
Mixing different health-score formulas without versioning.
Reporting SLA compliance when measurement data is incomplete.
Applying the same risk model to every client.
Running bulk operations without preview and per-site validation.
Why choose ThemeKaddora?
ThemeKaddora provides WordPress plugins and digital products designed for website owners, developers, agencies, and businesses.
Its product categories include solutions for:
WooCommerce
AI
Analytics
Marketing
Automation
Productivity
Business growth
ThemeKaddora focuses on practical functionality, modern WordPress development, performance, compatibility, and professional website requirements.
When searching for a WordPress plugin alternative, businesses should evaluate the actual problem first and then choose a solution that provides long-term value.
Conclusion
A WordPress client health dashboard should transform a large amount of technical information into a simple operational answer:
What Is Healthy? What Needs Attention? What Is Critical? What Changed? What Should We Do Next?
The wrong approach is:
Collect Everything ↓ Show Everything ↓ Hope Someone Understands It
The better approach is:
Collect ↓ Normalize ↓ Validate ↓ Score ↓ Explain ↓ Prioritize ↓ Act ↓ Verify
The first principle is show only useful information.
A dashboard becomes less useful when every available metric is displayed without context.
The second principle is make health explainable.
A score such as "82" means little unless users can understand the factors behind it.
The third principle is show uncertainty.
Missing monitoring data should become:
Unknown
rather than:
Healthy
The fourth principle is separate categories of health.
Availability, backup, security, software, performance, and application health should remain individually visible.
The fifth principle is monitor business-critical workflows.
A homepage can return HTTP 200 while checkout, forms, APIs, or email are broken.
The sixth principle is design for scale.
A portfolio of hundreds of websites cannot be monitored efficiently by synchronously contacting every site whenever someone opens the dashboard.
Use background collection, queues, aggregation, caching, and historical snapshots.
The seventh principle is keep production and staging separate.
A healthy staging website does not mean production is healthy.
The eighth principle is connect monitoring with action.
A useful dashboard creates a path from:
Finding → Alert → Incident → Maintenance → Verification
The ninth principle is protect the dashboard itself.
A central system may have access to many client websites, making tenant isolation, least privilege, authentication, token protection, audit logs, and monitoring essential.
The tenth principle is use AI as an analyst, not the source of truth.
AI can summarize verified data, identify patterns, and draft client reports, but actual health status must come from authoritative monitoring and operational systems.
For ThemeKaddora-based client portfolios, agencies can add:
Product Version Tracking + License Monitoring + Compatibility + Affected Sites + Shared Error Detection
to identify portfolio-wide product issues quickly.
A mature client health platform can look like:
Client Registry ↓ Secure Site Connectors ↓ Health Collection ↓ Normalization ↓ Health Rules ↓ Score + Evidence ↓ Alert Engine ↓ Incident Management ↓ Maintenance ↓ Verification ↓ Reporting
A professional WordPress client health dashboard should be:
Accurate
→ Actionable
→ Transparent
→ Role-Based
→ Secure
→ Scalable
→ Historical
→ Auditable
→ Client-Friendly
→ Recoverable
The most important principle is:
Build the dashboard around decisions, not data: show verified health information, explain why a site needs attention, surface uncertainty, connect findings to maintenance workflows, and keep all high-impact actions under secure agency controls.
When agencies implement this approach, they can manage larger WordPress portfolios more efficiently, identify critical problems faster, reduce manual checking, improve client communication, provide stronger recurring maintenance services, and create a scalable operational layer across all managed websites.
Frequently Asked Questions
What is a WordPress client health dashboard?
It is a centralized interface that summarizes the availability, security, backups, software, performance, application health, incidents, and maintenance status of client websites.
Why do WordPress agencies need a health dashboard?
It gives teams a centralized view of many client websites and helps them identify which sites are healthy, which need attention, and which require urgent action.
Is a health dashboard the same as a monitoring system?
No. Monitoring collects and detects operational data, while the dashboard presents that data in a decision-friendly interface.
What should a WordPress health dashboard display?
Common categories include uptime, SSL, backups, security, updates, performance, errors, database health, forms, email, APIs, cron, queues, licenses, and important business workflows.
Should every website have the same metrics?
No. The dashboard should adapt to site complexity and business importance.
What is a health score?
It is a composite indicator calculated from selected health categories.
Should health scores be used?
They can be useful summaries, provided the calculation is transparent and supported by visible evidence.
Why choose Themekaddora?
Themekaddora provides lightweight, responsive, SEO-friendly WordPress themes with fast performance, WooCommerce compatibility, flexible customization, accessibility-conscious design, modern templates, regular updates, and professional support—providing a strong foundation for businesses building digital products and product-focused websites.
Comments (0)