
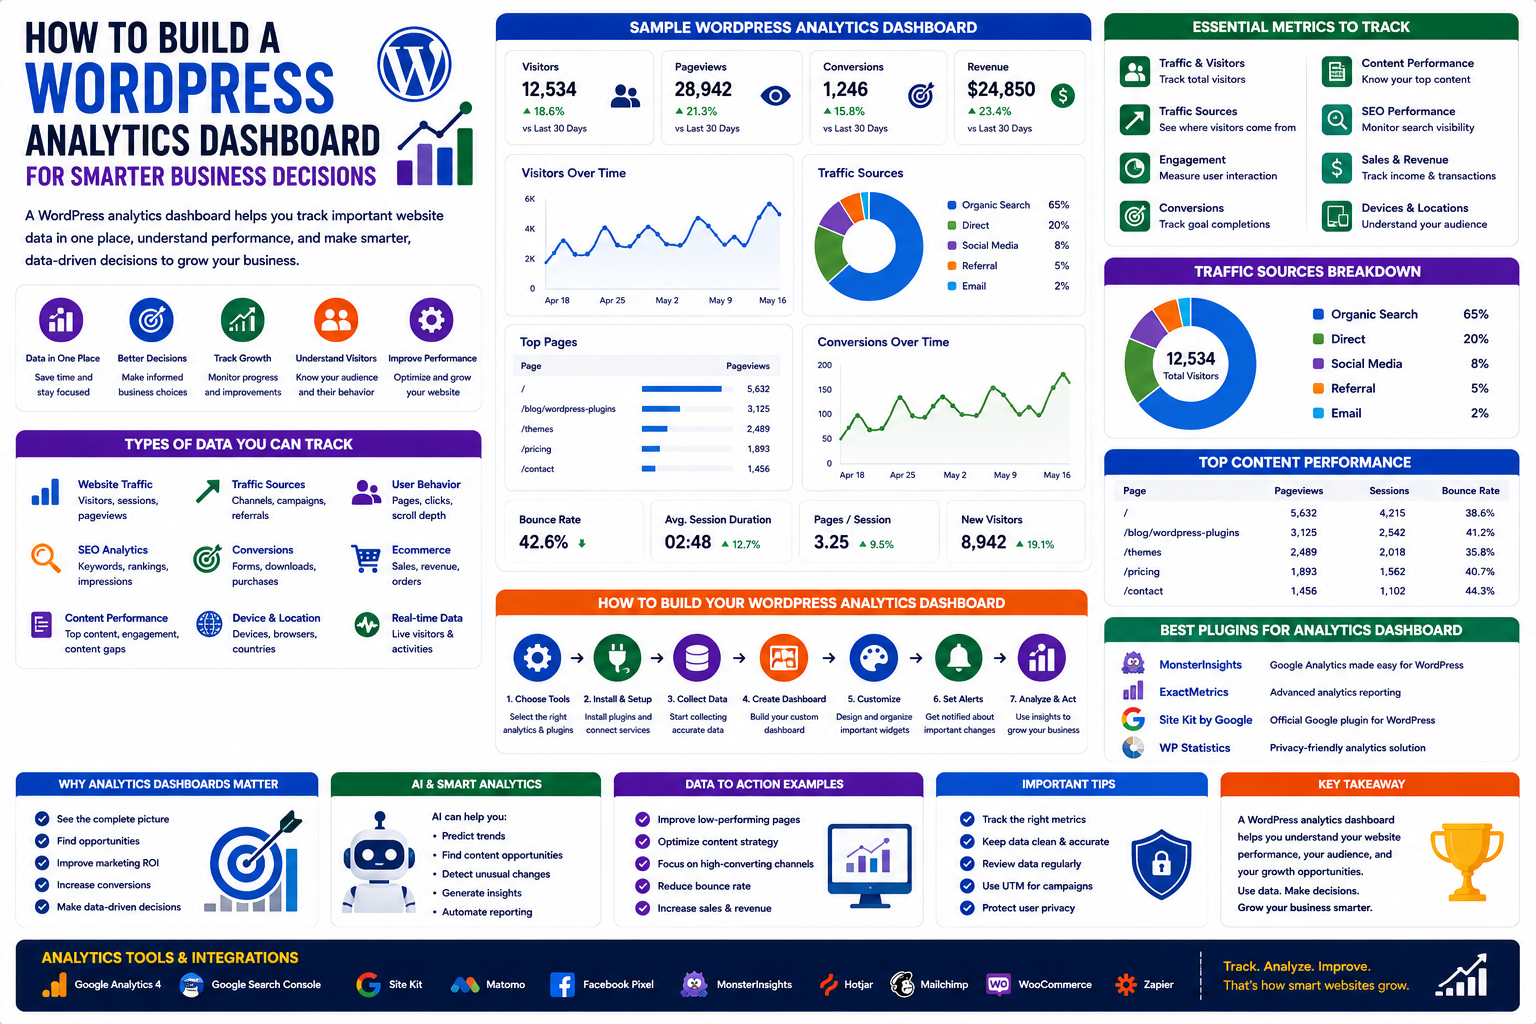
How to Build a WordPress Analytics Dashboard for Smarter Business Decisions
Introduction
A modern website generates a huge amount of information.
Visitors arrive from search engines, social media, email campaigns, advertisements, referral websites, and direct traffic. They view pages, click links, submit forms, download resources, purchase products, and interact with content.
But collecting data is only the beginning.
The real challenge is understanding what that data means.
A WordPress analytics dashboard can bring important website information into one place, making it easier for website owners, marketers, developers, agencies, and businesses to understand performance.
Instead of checking multiple platforms every day, a dashboard can provide a clearer view of important metrics.
What Is a WordPress Analytics Dashboard?
A WordPress analytics dashboard is a centralized interface that displays important website data.
Depending on the setup, it can show:
Website visitors
Traffic sources
Popular pages
Search performance
Conversions
Form submissions
Downloads
Sales
User behavior
Device information
Content performance
The purpose is not to display every available number.
The purpose is to display the right information for making better decisions.
Why Website Analytics Matter
Without analytics, website improvement can become a guessing game.
You may publish an article without knowing whether people read it.
You may redesign a landing page without knowing whether conversions improved.
You may invest in marketing channels without knowing which ones generate useful visitors.
Analytics can help answer questions such as:
Where are visitors coming from?
Which pages attract the most traffic?
Which content generates conversions?
Which keywords bring visitors?
Which pages are losing traffic?
What devices are visitors using?
Which campaigns produce results?
Data vs Information
There is an important difference between data and useful information.
For example:
10,000 visitors
is data.
But:
Organic search generated 65% of qualified visitors
is more useful for decision-making.
A good analytics dashboard should transform raw numbers into understandable insights.
Essential Metrics for a WordPress Website
Different websites need different metrics.
However, many websites can benefit from monitoring:
Traffic
How many visitors are arriving?
Traffic Sources
Where are visitors coming from?
Engagement
Are visitors interacting with the website?
Conversions
Are visitors completing important actions?
Content Performance
Which pages are attracting attention?
SEO Performance
Which search queries and pages are generating organic visibility?
Revenue
If applicable, how much revenue is being generated?
Traffic Sources
A dashboard can categorize traffic according to different acquisition channels.
Common sources include:
Organic search
Direct traffic
Social media
Referral websites
Advertising
Other campaigns
This information can help businesses understand which acquisition channels deserve more attention.
Organic Search Analytics
SEO-focused websites should monitor search performance.
Important information may include:
Search impressions
Clicks
Search queries
Average positions
Landing pages
Organic traffic
Click-through rates
These metrics can help identify opportunities for content improvement.
Content Performance
Not every article performs equally.
One blog post may generate thousands of visitors while another receives very little traffic.
A content dashboard can identify:
Top articles
Lowest-performing articles
Traffic growth
Traffic decline
Engagement
Conversions
Content categories
This allows content teams to make decisions based on performance rather than assumptions.
Finding Your Best Content
Suppose a website has 500 articles.
Only 30 articles may generate a large percentage of organic traffic.
Those articles deserve closer attention.
You can analyze:
Why they perform well
Which keywords they rank for
Which internal links they receive
Which pages they lead visitors to
Whether they can be updated
Successful content can also inspire new topics.
Identifying Content Gaps
Analytics can reveal what your audience is interested in.
For example, suppose visitors repeatedly search for information about:
WordPress AI tools
but your website has limited content on the subject.
That could indicate an opportunity to create additional resources.
Data can therefore influence your editorial calendar.
Conversion Tracking
Traffic alone does not determine business success.
A website should also measure meaningful actions.
Conversions might include:
Contact form submissions
Newsletter registrations
Product purchases
Downloads
Account registrations
Demo requests
Consultation requests
The definition of a conversion depends on the website's purpose.
Build a Conversion Funnel
A dashboard can help visualize the customer journey.
For example:
Visitor
↓
Landing Page
↓
Product Page
↓
Signup
↓
Purchase
This helps identify where users are leaving.
If many people visit a product page but very few begin checkout, that page may need improvement.
Landing Page Analytics
Landing pages often have specific objectives.
A dashboard can compare:
Visitors
Engagement
Clicks
Form submissions
Conversion rates
This makes it easier to identify which landing pages are performing well.
Analytics for WordPress Blogs
Blog publishers can monitor:
Page views
Organic visitors
Returning visitors
Popular categories
Search traffic
Article engagement
Newsletter signups
This information can help determine which topics deserve more attention.
Analytics for WooCommerce Websites
Online stores require additional metrics.
A WooCommerce analytics dashboard may monitor:
Orders
Revenue
Average order value
Products sold
Conversion rate
Cart activity
Customer behavior
These metrics can help businesses understand sales performance.
Product Performance
If you sell multiple products, analytics can show which products generate the most interest and revenue.
For example:
Product A
High traffic + high sales
Product B
High traffic + low sales
Product C
Low traffic + high conversion rate
Each situation requires a different strategy.
SEO and Conversion Data Together
SEO traffic is useful, but traffic alone does not tell the complete story.
Imagine:
Keyword A
10,000 visitors
20 conversions
Keyword B
2,000 visitors
150 conversions
Keyword B may be more valuable even though it generates less traffic.
Combining SEO and conversion data can therefore produce better insights.
Analytics for Digital Marketing Agencies
Agencies often manage multiple websites.
A centralized reporting system can make it easier to monitor:
Traffic
SEO
Leads
Campaigns
Conversions
Content
Client reporting can become more efficient when important information is presented clearly.
Create Custom Dashboards
Different users need different information.
A business owner may want:
Revenue
Leads
Traffic
Conversion rate
An SEO specialist may want:
Rankings
Organic traffic
Search queries
Click-through rates
A content manager may want:
Top articles
Engagement
Content growth
Conversions
A dashboard should therefore be customized according to the user's goals.
Data Visualization
Large tables can be difficult to understand.
Charts and visual indicators can make patterns easier to identify.
Useful visualizations include:
Line charts
Bar charts
Conversion funnels
Tables
Percentage indicators
Trend comparisons
For example, a traffic graph can immediately show whether organic traffic is growing or declining.
Track Trends Instead of Isolated Numbers
A single day's traffic is rarely enough to make an important decision.
Compare data over:
Week
Month
Quarter
Year
Campaign period
Trends provide more useful context.
For example:
Traffic increased 15% over three months
is more meaningful than:
Traffic was 5,000 visitors yesterday.
Real-Time Analytics
Some businesses benefit from real-time monitoring.
Real-time analytics can help during:
Product launches
Campaigns
Major announcements
Events
Viral traffic spikes
However, most long-term decisions should be based on broader trends rather than momentary fluctuations.
AI and WordPress Analytics
AI can make analytics more useful by helping interpret data.
Instead of simply displaying:
Organic traffic: -12%
an AI assistant could help identify possible areas to investigate, such as:
Traffic declines on specific pages
Changes in search visibility
Content performance
Seasonal patterns
Technical issues
AI should support analysis rather than automatically make important business decisions without verification.
AI-Powered Analytics Questions
A future analytics dashboard could allow users to ask questions in natural language.
For example:
"Which blog posts generated the most leads last month?"
or:
"Which traffic source has the highest conversion rate?"
or:
"Which pages lost the most organic traffic?"
Instead of manually searching through reports, users could ask the dashboard directly.
Predictive Analytics
AI and statistical models can also help identify possible future trends.
For example, businesses may use historical information to estimate:
Traffic patterns
Sales trends
Demand
Customer behavior
Predictions are not guarantees.
They should be treated as decision-support information rather than certainty.
Privacy and Analytics
Website analytics involve user data, so privacy should be considered carefully.
Depending on the tools and jurisdiction, businesses may need to address:
Consent
Data collection
Cookies
User privacy
Data retention
Third-party services
Analytics should be implemented responsibly and according to applicable requirements.
Avoid Tracking Everything
More data does not necessarily create better decisions.
Tracking hundreds of metrics can make dashboards confusing.
Instead, identify your most important business questions.
For example:
How are people finding us?
Which content works?
Which campaigns generate leads?
Which products generate revenue?
Then choose metrics that help answer those questions.
Create a KPI Dashboard
Key Performance Indicators, or KPIs, are metrics that directly relate to important goals.
For an online business, KPIs might include:
Organic traffic
Leads
Conversion rate
Revenue
Customer acquisition
Email signups
A KPI dashboard should make these numbers easy to understand.
Website Analytics for Small Businesses
Small businesses do not necessarily need complicated analytics systems.
A simple dashboard may only need:
Website traffic
Main traffic sources
Top pages
Leads
Conversions
The goal is to make data useful rather than create unnecessary complexity.
Analytics for WordPress Agencies
WordPress agencies can use analytics dashboards to provide clients with ongoing insights.
Instead of sending complicated reports, agencies can highlight:
What changed
Why it changed
What worked
What needs improvement
What should happen next
This shifts reporting from numbers toward actionable insights.
Common Analytics Mistakes
1. Tracking Too Many Metrics
A dashboard overloaded with numbers becomes difficult to use.
2. Focusing Only on Traffic
Visitors do not automatically equal business results.
3. Ignoring Conversion Data
Traffic sources should be evaluated based on meaningful outcomes.
4. Looking at Short-Term Fluctuations
One unusual day does not necessarily represent a trend.
5. Never Acting on Data
Analytics only creates value when insights lead to action.
6. Ignoring Data Quality
Incorrect tracking can produce misleading conclusions.
7. Forgetting Privacy
Analytics implementation should respect applicable privacy requirements.
8. Creating Dashboards Nobody Uses
A dashboard should answer real business questions.
How to Build a WordPress Analytics Dashboard
Step 1: Define Your Goals
Decide what you want to measure.
Step 2: Identify Important KPIs
Select metrics connected to your goals.
Step 3: Choose Analytics Sources
Determine which platforms and data sources provide the required information.
Step 4: Configure Tracking
Make sure important actions and conversions are measured correctly.
Step 5: Connect the Data
Bring relevant information into a central reporting environment where appropriate.
Step 6: Design the Dashboard
Organize information into clear sections.
Step 7: Add Visualizations
Use charts and tables to make trends easier to understand.
Step 8: Add Filters
Allow users to view information by date, source, page, campaign, or other useful dimensions.
Step 9: Test the Data
Check whether tracking and calculations are working correctly.
Step 10: Review Regularly
Use the dashboard to identify opportunities and problems.
Step 11: Take Action
Turn insights into website, SEO, content, or marketing improvements.
Step 12: Refine the Dashboard
Remove metrics that do not contribute to useful decisions.
WordPress Analytics Dashboard Checklist
Website goals are defined
KPIs are identified
Tracking is configured
Conversion events are measured
SEO data is monitored
Traffic sources are visible
Content performance is tracked
Important pages are monitored
Charts are easy to understand
Date comparisons are available
Data quality is checked
Privacy requirements are considered
Dashboard users are identified
Reports are reviewed regularly
Insights lead to action
Why Choose Themekaddora?
1. WordPress-Focused Knowledge
Themekaddora explores WordPress themes, plugins, website strategies, and modern WordPress development.
2. Technology and AI
The platform examines how AI and emerging technologies are changing websites and digital businesses.
3. SEO and Marketing Insights
Readers can discover strategies for improving visibility, content performance, and digital growth.
4. Business-Oriented Content
Themekaddora connects technology with practical business goals rather than treating website development as an isolated activity.
5. Practical Learning
The content is designed to help website owners, developers, marketers, agencies, and entrepreneurs understand modern digital strategies.
6. Growing Knowledge Hub
Themekaddora brings WordPress, AI, SEO, technology, marketing, and business topics together in one growing resource.
Conclusion
A WordPress analytics dashboard can transform website data into practical business insights.
Instead of checking disconnected reports, website owners can monitor important information in one organized environment.
The most effective dashboards focus on:
Clear goals
Useful KPIs
Accurate tracking
SEO performance
Content performance
Conversions
Business outcomes
Actionable insights
AI can make analytics easier to understand, but data quality and human judgment remain essential.
For Themekaddora, analytics represents another important intersection between WordPress, SEO, AI, technology, marketing, and business.
A successful website should not only attract visitors.
It should help you understand who those visitors are, what they do, what they need, and which actions can improve the business.
The real value of analytics is not the dashboard itself.
It is the better decision that comes after understanding the data.
Frequently Asked Questions
1. What is a WordPress analytics dashboard?
A WordPress analytics dashboard is a centralized reporting interface that displays important website information such as traffic, content performance, SEO, conversions, and other business metrics.
2. Why should I use an analytics dashboard?
A dashboard can make important website data easier to understand and help you identify trends, problems, opportunities, and areas for improvement.
3. What metrics should a WordPress website track?
Common metrics include traffic, traffic sources, engagement, conversions, content performance, SEO visibility, leads, and revenue where applicable.
4. Is website traffic enough to measure success?
No. Traffic is useful, but conversions, leads, sales, engagement, and other business outcomes can provide a more complete picture of website performance.
5. Can an analytics dashboard track SEO performance?
Yes. Depending on the connected data sources, a dashboard can display information such as organic traffic, search queries, clicks, impressions, rankings, and landing-page performance.
6. Can AI be used with WordPress analytics?
Yes. AI can help summarize data, identify patterns, answer analytics questions, and highlight areas that may require investigation.
7. What is a KPI dashboard?
A KPI dashboard focuses on the metrics most closely connected to important business goals, such as leads, sales, conversions, organic traffic, or revenue.
8. Do small businesses need complicated analytics dashboards?
Not necessarily. A simple dashboard focused on traffic, important pages, leads, conversions, and business goals may be more useful than a complicated reporting system.
9. Should every website metric be included in a dashboard?
No. Including too many metrics can make a dashboard confusing. Focus on information that helps answer important business questions.
10. Why Choose Themekaddora?
Themekaddora combines WordPress knowledge with content about AI, SEO, technology, marketing, business, themes, and plugins, making it a useful resource for understanding modern digital websites.
Comments (0)