
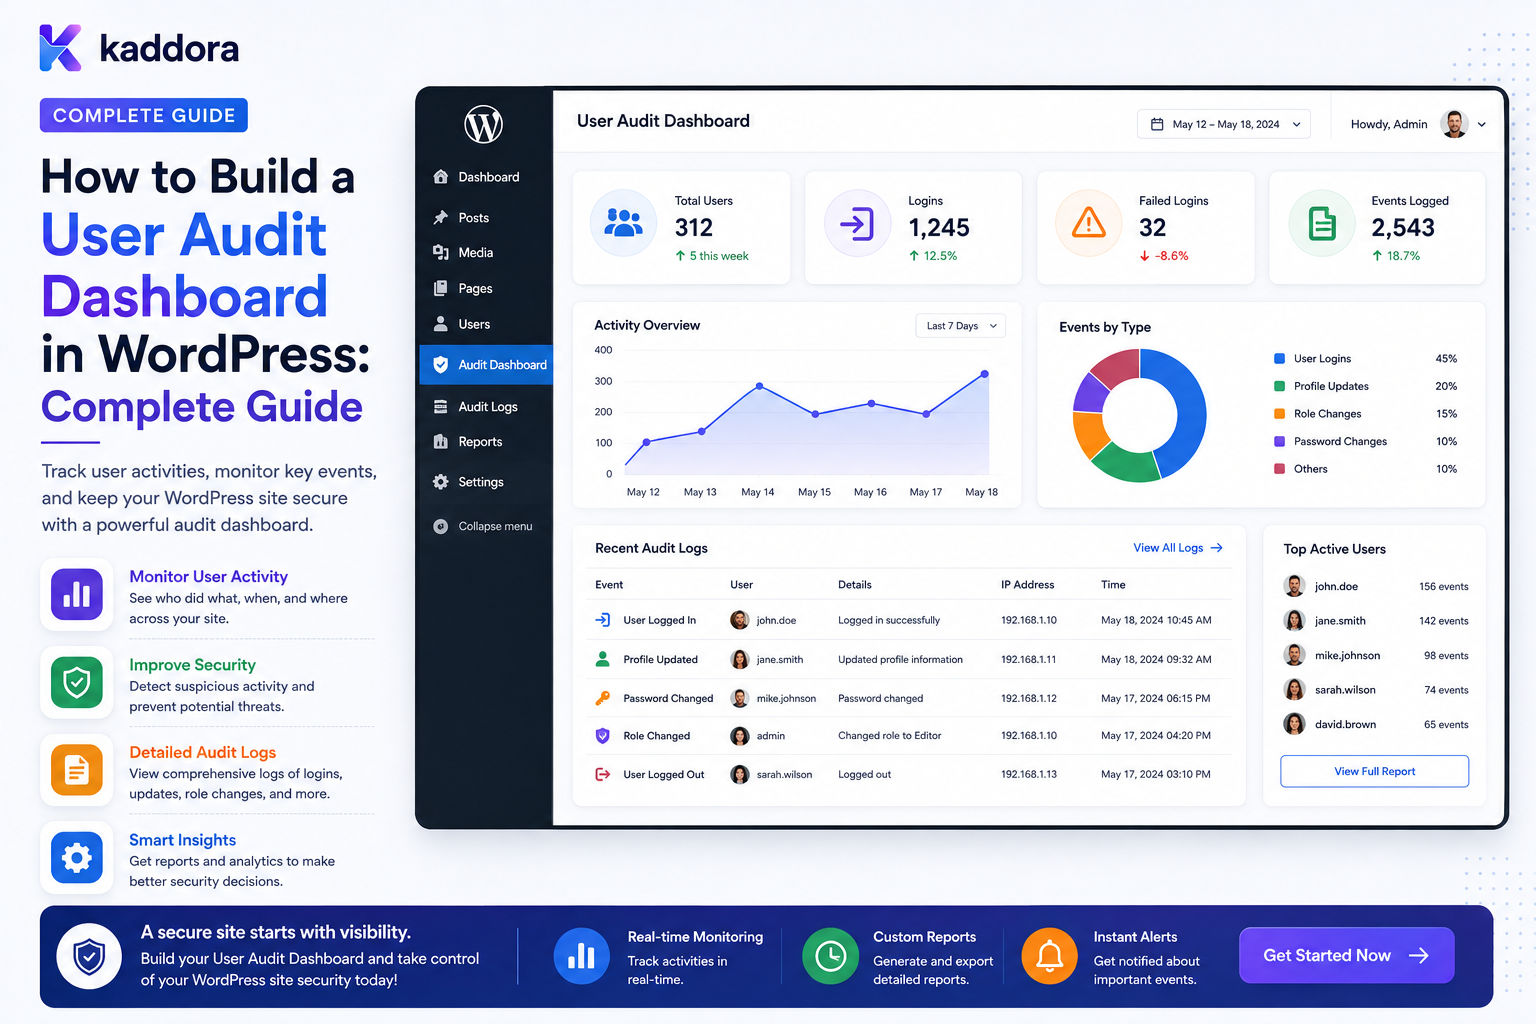
How to Build a User Audit Dashboard in WordPress: Complete Guide
Introduction
A WordPress application can contain thousands of important user-related events.
Administrators may need to understand:
Who logged in? Who changed a password? Who changed a role? Who received temporary access? Who exported data? Who approved a request? Who was suspended? Who changed department membership?
A raw audit log is useful, but difficult to investigate.
A user audit dashboard turns structured account events into an interface that helps administrators, managers, security teams, and authorized users understand what happened.
A basic dashboard might show:
Account Events Today 1,240 Role Changes 8 Permission Changes 15 Failed Logins 31 Exports 5
A more advanced dashboard can provide:
Filters Timelines User Search Security Events Permission Changes Role History Session Events Exports Reports Alerts
The architecture can look like:
Account Events ↓ Secure Event Store ↓ Authorization Policy ↓ Aggregation / Query ↓ Audit Dashboard ↓ Reports / Export / Alerts
The dashboard itself is not the security boundary.
The underlying event queries and APIs must enforce authorization independently.
The key principle is:
A user audit dashboard should provide a clear view of meaningful account and security events while enforcing strict server-side visibility, tenant, role, department, and field-level controls for every report and data source.
What Is a WordPress User Audit Dashboard?
A WordPress user audit dashboard is a centralized interface for reviewing important activity and security events associated with user accounts.
Typical information includes:
Account Creation Login Events Password Changes Email Changes Role Changes Permission Changes Team Changes Department Changes Suspensions Session Revocations Exports Approvals
The dashboard can be:
Administrator Only Security Team Only Manager Restricted Tenant Admin User Self-Service
The visibility model should be defined before implementation.
Why Build a User Audit Dashboard?
A dashboard can help with:
Security investigations
Account troubleshooting
Access reviews
Compliance workflows
User support
Incident response
Permission reviews
Organizational monitoring
It can also make complex audit information easier to understand.
Audit Log vs Audit Dashboard
These serve different purposes.
Audit Log
Stores events:
user.role_changed user.password_changed user.permission_granted
Audit Dashboard
Provides:
Search Filters Charts Timelines Summaries Reports Exports
The dashboard reads from the audit system.
It should not become the only place where audit records exist.
Start With an Audit Event Model
Before building the UI, define the event structure.
For example:
Event ID Event Type Actor Target Tenant Department Team Timestamp Result Source Request ID
Additional context can include:
Resource Reason IP Metadata
only when justified.
Important User Audit Events
A useful event catalog may include:
user.created user.logged_in user.login_failed user.password_changed user.email_changed user.profile_updated user.role_changed user.permission_granted user.permission_revoked user.session_revoked user.suspended user.reactivated
Business workflows can add:
user.team_joined user.department_changed user.access_requested user.access_approved user.access_expired user.data_exported
Don't Build the Dashboard Around Raw Database Tables
Avoid designing the dashboard around:
wp_users wp_usermeta
alone.
The audit dashboard needs event-oriented data.
A dedicated event store can make filtering, indexing, and retention much easier for high-volume applications.
Event Storage
A conceptual audit table may contain:
id event_type actor_id target_user_id tenant_id department_id result source request_id occurred_at
The exact schema depends on application requirements.
Audit Event Indexes
Common dashboard filters include:
Actor Target User Event Type Tenant Department Time
Indexes should be based on actual query patterns.
Do not create large numbers of indexes without considering write cost.
Security of the Audit Store
Audit records can contain sensitive information.
Protect the event store from:
Unauthorized Viewing Unauthorized Modification Unauthorized Deletion
A user should generally not be able to erase the history of their own security actions.
Dashboard Access Control
Different users may need different audit visibility.
For example:
User → Own Account Events Manager → Team Events Department Manager → Department Events Security → Security Events Tenant Administrator → Tenant Events
The exact access model depends on the organization.
Never Treat Administrator as Unlimited Business Scope
A WordPress Administrator role does not automatically define every application-specific audit permission in a multi-tenant system.
The application's own authorization model should determine:
Which Tenant? Which Department? Which Events? Which Fields?
Tenant Isolation
In a SaaS application:
Tenant A ↓ Audit Events
must remain separate from:
Tenant B
A dashboard filter such as:
tenant_id=42
must not grant access by itself.
The server must resolve the viewer's authorized tenant scope.
Department Scope
A department manager might see:
Finance Activity
but not:
Engineering Activity
unless explicitly authorized.
Team Scope
A team leader may see:
Engineering Team ↓ Activity
without seeing events from other teams in the same department.
User Self-Service Audit
A user-facing audit page might show:
My Security Activity Login Password Changed Email Changed Session Revoked
Avoid exposing internal administrative information.
Field-Level Audit Visibility
Not every viewer needs every event field.
For example:
Manager: Actor Event Time Result Security: Actor Event Time Result Source Additional Security Context
The API should return only authorized fields.
Don't Hide Sensitive Data With CSS
An API response should not include:
{ "private_security_note": "...", "internal_ip_data": "..." }
and merely hide it visually.
Unauthorized fields should not be sent to the browser.
Dashboard Summary Cards
Useful metrics include:
Events Today Failed Logins Role Changes Permission Changes Exports Suspensions
These should be calculated from the viewer's authorized dataset.
Event Trend Charts
The dashboard may display:
Events │ │ ╭──╮ │ ╭───╯ ╰───╮ │───╯ ╰── └────────────────── Time
Possible metrics:
Successful Logins Failed Logins Permission Changes Exports Account Changes
Avoid showing aggregate data that itself reveals unauthorized organizational information.
Activity Timeline
A timeline is one of the most useful audit views.
Example:
10:05 John logged in. 10:32 John changed profile information. 11:15 Manager granted Finance Reports access. 13:05 John exported an approved report.
The system should make actor and target distinctions clear.
User-Specific Audit Timeline
Selecting a user can show:
John Smith Account Created Email Verified Password Changed Department Changed Permission Granted Session Revoked
This can be useful during account investigations.
Audit Event Detail
Clicking an event can show:
Event: user.permission_granted Actor: Jane Doe Target: John Smith Permission: view_finance_reports Scope: Finance Time: 11:15 Result: Success
Only fields approved for the current viewer should be displayed.
Security Event Indicators
High-value events can be categorized:
Low Medium High Critical
For example:
Profile Update: Low Role Change: High Administrator Permission Granted: Critical
Risk classification should remain explainable and configurable.
Risk Indicators Are Not Authorization
A label such as:
Risk: Low
does not determine whether the event was authorized.
The dashboard is reporting events, not granting access.
Audit Filters
Useful filters include:
Event Type User Actor Department Team Tenant Result Source Date Risk
Every filter must remain within the viewer's authorized scope.
Date Filters
Offer options such as:
Today 7 Days 30 Days Quarter Custom Range
Set sensible maximum ranges for expensive queries.
Event-Type Filters
An administrator could choose:
Authentication Permissions Roles Profile Sessions Exports Approvals
This makes investigations easier.
Failed-Event Filter
A security user may select:
Result: Failure / Denied
and investigate:
Login Failures Permission Denials Export Denials
Source Filters
Events may originate from:
Web Admin REST AJAX Import Queue Cron CRM ERP System
This can help identify unexpected paths.
Activity Search
Search can support:
User Name Email Event Type Resource Request ID
Only approved searchable fields should be indexed.
Search Security
Search queries should be applied to the user's authorized event scope.
Do not:
Search All Events ↓ Filter Results in Frontend
Instead:
Resolve Scope ↓ Query Only Authorized Events
Pagination
Large audit streams require pagination.
Use:
Page Size Cursor Next Page
with server-side maximum limits.
Cursor-Based Audit Browsing
For large logs:
Newest ↓ Cursor ↓ Older
is often useful for chronological investigation.
Audit Exports
Security teams may need:
CSV JSON
exports.
Export permission should be separate from viewing permission.
Secure Audit Export
Generated audit files may contain:
User Names Login Times Administrative Actions Security Events
Store them securely and give them an appropriate expiration period.
Export Audit Event
An export operation should itself create an event:
audit.export_created
and potentially:
audit.export_downloaded
This provides accountability around sensitive audit access.
Audit Export Scope
A manager may be allowed:
Team Audit
but not:
Organization-Wide Audit
unless explicitly authorized.
Audit Dashboard APIs
A custom endpoint might expose:
GET /wp-json/kdr/v1/audit GET /wp-json/kdr/v1/audit/{id} POST /wp-json/kdr/v1/audit/export
Every endpoint must validate:
Authentication Capability Tenant Department Team Event Scope
Prevent IDOR
A request such as:
GET /audit/500
must not reveal an event merely because the requester knows the event ID.
The server must validate the viewer's authorization.
Audit Dashboard and AJAX
AJAX endpoints need exactly the same policy as REST and page requests.
A hidden interface does not provide protection.
Audit Dashboard Caching
Aggregate metrics can often be cached safely when the scope is shared.
Detailed user-specific audit timelines need more careful cache handling.
Avoid Cross-Viewer Cache Leakage
Manager A should not receive:
Manager B's Audit Report
because the cache key omitted the viewer or scope.
Audit Dashboard Performance
Audit dashboards can become expensive when querying:
Millions of Events Large Date Ranges Many Filters Complex Aggregations
Optimize queries according to real usage.
Aggregated Audit Tables
For high-volume reporting, maintain precomputed summaries such as:
Daily Login Counts Daily Permission Changes Daily Export Counts
This can reduce expensive dashboard queries.
Background Aggregation
A worker can calculate:
Raw Events ↓ Daily Summary ↓ Dashboard
while the detailed event store remains available for investigation.
Archive Old Audit Events
Older events can move to:
Archive Storage
while recent events remain in the operational database.
This can improve dashboard performance.
Retention Policies
Different event categories may have different retention requirements:
Security Audit Account Lifecycle Operational Activity Analytics
Do not retain everything forever by default.
Audit Log Integrity
An audit system should preserve historical integrity.
Consider:
Append-Oriented Events Restricted Deletion Restricted Modification Administrative Separation
for high-sensitivity audit records.
Protect Audit Administration
The person who manages the audit system should not automatically be able to erase historical events without oversight.
For high-risk environments, consider separation of duties.
Audit Event Correlation
A single workflow may produce:
access.requested access.approved permission.granted notification.sent
A correlation ID can connect these events for investigation.
Audit Dashboard and Distributed Systems
A business operation may involve:
WordPress CRM ERP Queue Email
Correlation IDs and event IDs make cross-system investigations easier.
System vs Human Events
The dashboard should distinguish:
John Smith
from:
Background Worker
and:
CRM Integration
This avoids confusing automation with human activity.
Audit Dashboard Alerts
High-value events can trigger alerts:
Administrator Granted Large Export Repeated Access Denials Multiple Role Changes Unexpected Session Revocation
Alert Aggregation
Avoid:
1 email per event
for high-volume conditions.
Use aggregated alerts:
38 denied access attempts within 10 minutes
Audit Dashboard and Incident Response
During an incident:
Identify Account ↓ Filter Audit ↓ Review Timeline ↓ Identify Privileged Actions ↓ Contain Access ↓ Investigate
A structured dashboard can reduce investigation time.
Account Compromise Investigation
Useful filters include:
Target User Authentication Events Permission Changes Exports Session Events
This can help establish a timeline.
Access-Change Investigation
For a role issue:
Filter: user.role_changed
Then inspect:
Actor Target Previous Role New Role Timestamp Source
Export Investigation
For a suspicious export:
Filter: audit.export_created audit.export_downloaded
Then correlate:
Actor Scope Time Tenant Result
Audit Dashboard for Managers
A manager might see:
Team Activity Account Changes 8 Permission Requests 5 Approvals 12 Suspensions 1
The report should remain limited to the manager's team.
Audit Dashboard for Security Teams
Security users may see:
Security Overview Failed Logins 34 Role Changes 7 Permission Grants 14 Sensitive Exports 5
More detailed security context can be restricted to appropriately authorized users.
Audit Dashboard for Users
A self-service dashboard might show:
My Security Recent Logins Password Changes Email Changes Sessions Access Changes
This improves transparency without exposing internal audit data.
Dashboard Widget Registry
A reusable plugin can define:
Widget Key Title Permission Data Scope Data Provider Cache Strategy
Examples:
failed_login_summary permission_change_summary recent_account_events suspicious_activity
Data Provider Security
Each widget provider should apply authorization.
For example:
SecurityEventProvider
should receive a trusted audit scope and never query arbitrary tenant data based on client parameters.
Don't Put Authorization Only in UI Code
Avoid:
if userIsSecurity: showSecurityWidget()
without protecting the API.
The provider and endpoint must enforce authorization independently.
Audit Dashboard and AI
AI can summarize authorized audit data:
Last 24 Hours AI Summary: 3 role changes, 2 temporary grants, and 1 unusual export attempt.
The AI should only access records already filtered by authorization.
AI Investigation Assistance
AI can help answer:
"What changed for this account today?"
using authorized events.
Human investigators should remain responsible for final security decisions.
Do Not Let AI Hide Audit Events
AI summaries are a convenience layer.
The underlying structured audit records should remain accessible to authorized investigators.
Audit Dashboard and Privacy
Audit records may contain:
Identity Login Timing Account Changes Security Events Organizational Information
Treat the dashboard as sensitive administrative software.
Don't Use Audit Dashboards for Unnecessary Surveillance
The purpose should be defined.
A security and governance dashboard should not automatically become a system for monitoring every employee action indefinitely.
Audit Dashboard Retention
Define:
Event Retention Report Retention Export Retention Archive Retention
These can be different.
Audit Dashboard Access Reviews
Periodically review:
Who Can View Audit? Who Can Export? Who Can Modify Retention? Who Can Manage Audit Settings?
This protects the audit system itself.
Common WordPress User Audit Dashboard Mistakes
Showing Raw Audit Data Without Authorization
Sensitive events leak across teams or tenants.
Hiding Widgets Instead of Securing APIs
Users can call endpoints directly.
No Tenant Scope
Multi-tenant customers see each other's activity.
Logging Too Much Data
Audit storage becomes noisy and privacy-sensitive.
No Audit Integrity
Users can alter or delete historical events.
Global Caching
Private audit data leaks between viewers.
No Retention Policy
Storage grows indefinitely.
Export Without Permission
Sensitive activity becomes downloadable.
No Event Correlation
Investigations become harder.
Treating AI Summary as the Audit Record
Summaries can omit important details.
WordPress User Audit Dashboard Checklist
- [ ] Define audit event catalog - [ ] Define audit users and scopes - [ ] Define tenant isolation - [ ] Define department / team scopes - [ ] Define field visibility - [ ] Define dashboard widgets - [ ] Define report permissions - [ ] Define export permissions - [ ] Create event storage - [ ] Add useful indexes - [ ] Add aggregation - [ ] Add pagination - [ ] Add filtering - [ ] Add timeline views - [ ] Add event detail views - [ ] Add correlation IDs - [ ] Protect audit data - [ ] Add retention - [ ] Add archiving - [ ] Add secure exports - [ ] Add audit-of-audit events - [ ] Add alerting - [ ] Add safe caching - [ ] Test IDOR - [ ] Test cross-tenant leakage - [ ] Test privilege escalation - [ ] Test cache leakage - [ ] Test export access
Best Practices for Building a WordPress User Audit Dashboard
A professional audit dashboard should:
Start with a clearly defined audit-event catalog rather than displaying every database change.
Separate the audit event store from the dashboard presentation layer.
Apply authorization before querying events, not after data has already been retrieved.
Enforce user, team, department, project, client, and tenant scopes server-side.
Provide field-level visibility for sensitive audit context.
Never expose passwords, tokens, recovery credentials, private keys, or other secrets.
Use structured event records with stable IDs, actors, targets, timestamps, results, and sources.
Use pagination, cursor-based browsing, aggregation, and archival for large event volumes.
Protect audit records from unauthorized modification and deletion.
Treat audit exports as sensitive data and use protected storage, authorization, expiration, and audit tracking.
Use correlation IDs to connect multi-step account and security workflows.
Distinguish human, system, integration, and automation actors.
Apply retention policies according to event purpose and sensitivity.
Use alerts for high-signal security events rather than overwhelming administrators with low-value notifications.
Keep AI analysis downstream of the authorization layer and never treat AI summaries as a replacement for source audit records.
Review who can access and administer the audit system itself.
Test IDOR, cross-tenant leakage, privilege escalation, API bypass, cache leakage, export abuse, and audit-integrity failures.
Why choose ThemeKaddora?
ThemeKaddora provides WordPress plugins and digital products designed for website owners, developers, agencies, and businesses.
Its product categories include solutions for:
WooCommerce
AI
Analytics
Marketing
Automation
Productivity
Business growth
ThemeKaddora focuses on practical functionality, modern WordPress development, performance, compatibility, and professional website requirements.
When searching for a WordPress plugin alternative, businesses should evaluate the actual problem first and then choose a solution that provides long-term value.
Conclusion
A user audit dashboard turns a large collection of account events into a practical security and governance tool.
A basic system might show:
Events ↓ Table
A mature system provides:
Summary ↓ Filters ↓ Timeline ↓ Event Details ↓ Investigation ↓ Reports ↓ Exports ↓ Alerts
The first principle is protect the audit data itself.
An audit dashboard is a sensitive administrative application, not just a reporting page.
The second principle is enforce authorization before querying.
Never retrieve a global event dataset and attempt to hide unauthorized records afterward.
The third principle is define scope clearly.
A user, manager, department, security team, and tenant administrator may all need different views.
The fourth principle is make important events searchable.
Consistent event types, actors, targets, timestamps, and request IDs make investigations much faster.
The fifth principle is protect audit integrity.
A reliable audit history should not be casually editable by the same users whose actions it records.
The sixth principle is design for scale.
High-volume platforms need indexing, aggregation, pagination, archival, and retention strategies.
The seventh principle is protect exports.
An exported audit report can contain highly sensitive security and personal information.
The eighth principle is use alerts carefully.
High-signal events should trigger actionable alerts without overwhelming security teams.
The ninth principle is keep AI downstream of authorization.
AI can summarize authorized events but should never become an alternate path around access control.
The tenth principle is audit the audit system.
Important audit actions such as report exports, retention changes, and administrative access to audit data should themselves be tracked.
For ThemeKaddora, user audit dashboards can support:
Employees Managers Customers Agencies SaaS Tenants Security Teams Enterprise Accounts Business Applications
The most important principle is:
An audit dashboard should make important account events easier to investigate without weakening the security model that protects those events.
A professional WordPress user audit dashboard should be:
Secure
→ Scoped
→ Structured
→ Searchable
→ Auditable
→ Privacy-Conscious
→ Tenant-Aware
→ Performant
→ Exportable
→ Maintainable
When these principles are applied, WordPress can provide practical security timelines, permission reviews, account investigations, access reports, and organizational audit dashboards without turning the audit system itself into a source of data leakage.
Frequently Asked Questions
What is a WordPress user audit dashboard?
It is an administrative interface that displays important account, security, permission, and lifecycle events in a searchable and scoped format.
Who should have access to an audit dashboard?
Access should depend on the organization's requirements. Users may see their own events, managers may see team activity, and security teams may receive broader authorized access.
Should an audit dashboard show every WordPress action?
No. It should focus on meaningful account, security, governance, and business events.
Can a manager see an employee's audit history?
Yes, when authorized. The dashboard should restrict both the users and the fields the manager is allowed to see.
How should a user audit dashboard work in a multi-tenant SaaS?
Every event, query, API, export, and cache must remain within the viewer's authorized tenant scope.
Should audit logs include passwords?
Never. Passwords, session tokens, OTPs, API secrets, and recovery credentials should never be stored in ordinary audit records.
Can audit events be exported?
Yes, but exports should require separate permission, use protected storage, expire after an appropriate period, and create their own audit events.
How can a large audit dashboard remain fast?
Use indexed event storage, scoped queries, pagination, cursor navigation, aggregation, caching where safe, and archival.
Can an audit dashboard use REST APIs?
Yes. REST can power dynamic audit interfaces, but each endpoint must enforce authorization and scope independently.
Can AI summarize audit events?
Yes. AI can summarize authorized audit records or assist investigations, but the underlying audit records remain the authoritative source.
Should audit events ever be deleted?
They can be archived or deleted according to an explicit retention policy, but ordinary users should not be able to erase their own security history.
Why choose Themekaddora?
Themekaddora provides lightweight, responsive, SEO-friendly WordPress themes with fast performance, WooCommerce compatibility, flexible customization, accessibility-conscious design, modern templates, regular updates, and professional support—providing a strong foundation for businesses building digital products and product-focused websites.
Comments (0)