
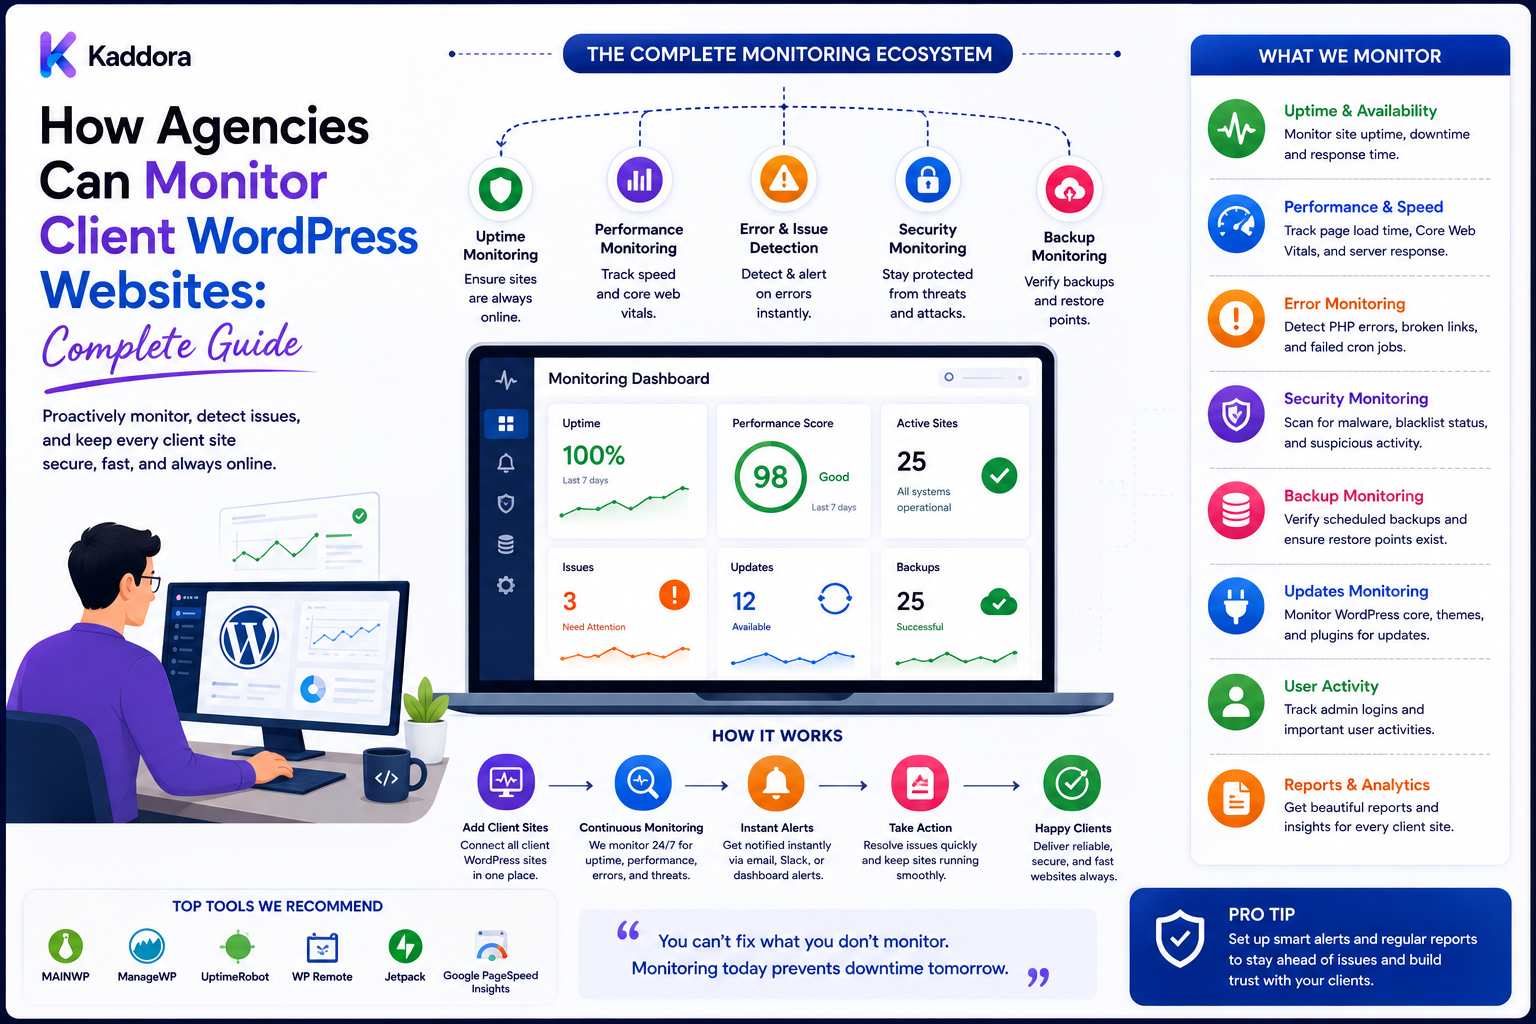
How Agencies Can Monitor Client WordPress Websites: Complete Guide
Introduction
Managing a WordPress website does not end after launch.
Websites change continuously.
Plugins are updated. Traffic increases. SSL certificates approach expiration. APIs change. Databases grow. Forms fail. Hosting resources become constrained. Security events occur. Third-party services stop responding.
When an agency manages multiple client websites, manually checking every site is inefficient and unreliable.
A better approach is to create a centralized monitoring system that continuously collects important signals.
A professional monitoring workflow can look like:
Client Website ↓ Monitoring Checks ↓ Collect Data ↓ Detect Anomaly ↓ Classify Severity ↓ Create Alert ↓ Notify Team ↓ Investigate ↓ Resolve ↓ Document
For multiple websites:
Client A ─┐ Client B ─┤ Client C ─┤ Client D ─┤ ↓ Central Monitoring ↓ Dashboard ↓ Alerts / Reports
The purpose is not to monitor everything possible.
The goal is to identify the signals that matter to the client's business.
Professional WordPress monitoring should combine availability, security, performance, software state, application health, and business-critical workflow checks in one controlled operational process.
What Is WordPress Website Monitoring?
Website monitoring is the continuous or scheduled observation of important website and infrastructure signals.
An agency may monitor:
Uptime SSL Response Time Errors WordPress Version Plugin Versions Theme Versions Backups Security Forms APIs Cron Queues Database Performance
Different clients need different monitoring depth.
Why Agencies Need Client Monitoring
Monitoring helps agencies:
Detect outages faster
Identify problems before clients report them
Protect important workflows
Track software changes
Improve support response
Build maintenance services
Generate useful client reports
Manage large portfolios more efficiently
A monitoring system effectively acts as an early-warning layer.
Monitoring vs Maintenance
These are related but different.
Monitoring
Answers:
What is happening right now?
Maintenance
Answers:
What should we change or improve?
For example:
Monitoring: Plugin update available. Maintenance: Test and apply the update.
Monitoring should provide evidence for maintenance decisions.
Define Monitoring Objectives
Before collecting data, define what the agency wants to detect.
Examples:
Site Down SSL Near Expiry Repeated PHP Errors Backup Failure Unexpected Administrator Slow Response Plugin Version Drift Form Failure
Avoid monitoring signals that never lead to action.
Classify Sites by Risk
Not every website needs the same monitoring level.
Low Risk
Simple marketing site.
Medium Risk
Business website with lead generation.
High Risk
WooCommerce, SaaS, membership, or business-critical platform.
A higher-risk site generally needs more monitoring and stronger alerting.
Site Inventory
A monitoring platform should maintain:
Site ID Client Production URL Staging URL Hosting WordPress Version PHP Version Theme Plugins Maintenance Plan Risk Level Monitoring Status
Sensitive credentials should not be stored in ordinary inventory fields.
Site Identity
Use a stable internal site ID:
site_001 site_002 site_003
Do not rely only on the domain because domains can change.
Environment Identity
Maintain separate records for:
Production Staging Development
This prevents monitoring data from becoming mixed.
Uptime Monitoring
The most basic check is:
HTTP Request ↓ Response ↓ Status ↓ Latency
Monitor:
HTTP status
Response time
Availability
Do not treat one transient network failure as a confirmed outage.
Multi-Location Monitoring
For important websites, monitoring from multiple locations can help distinguish a local network problem from a broader outage.
This is especially useful for high-value websites.
HTTP Status Monitoring
Track:
2xx 3xx 4xx 5xx
The exact expected status depends on the resource.
Repeated 5xx responses generally deserve investigation.
Response Time Monitoring
Monitor response latency over time.
A sudden increase may indicate:
Hosting Load Database Problems External API Delays Plugin Issues Network Problems
Response time should be interpreted relative to the website's normal baseline.
SSL Monitoring
Monitor:
Certificate Validity Expiration Date HTTPS Availability Certificate Chain
Notify the responsible team before expiration.
DNS Monitoring
Where relevant, monitor important DNS records and resolution behavior.
Be careful when interpreting DNS changes because some changes are legitimate.
Domain Monitoring
Track:
Domain Expiration Registrar DNS Provider Status
Domain monitoring can complement website monitoring.
WordPress Health Monitoring
A WordPress-specific monitor can inspect:
WordPress Version PHP Version Active Theme Plugin State Database Connectivity REST API Cron
This goes beyond simply checking whether the homepage responds.
Plugin Version Monitoring
Track:
Installed Version Available Version Approved Version Status
Separate:
Update Available
from:
Update Approved
Theme Version Monitoring
Track active theme and child-theme details.
Theme changes can affect layout and functionality.
PHP Version Monitoring
Track the PHP version for every production environment.
Version differences matter when planning updates and troubleshooting.
WordPress Version Drift
A centralized dashboard can identify:
Client A: Current Client B: Behind Client C: Unsupported
The exact classification should depend on the agency's support policy.
Configuration Drift
Monitor important approved settings where feasible:
Expected vs Actual
Examples include:
Plugin Active State Security Settings Environment Flags
Security Monitoring
Security monitoring can identify:
Unexpected Admin Users Privilege Changes Outdated Software Suspicious File Changes Security Alerts
No monitoring system detects every possible attack. It should complement secure development, access control, backups, and other security controls.
Administrator Monitoring
Alert when a new administrator is created unexpectedly.
Also monitor:
Unexpected Privilege Increase User Removal Suspicious Login Patterns
Use appropriate thresholds to avoid excessive noise.
File Integrity Monitoring
Track unexpected changes to important files.
However, WordPress updates and deployments naturally modify files.
Correlate file changes with known releases to reduce false positives.
Security Plugin Monitoring
If the client uses a security plugin, monitor important findings and plugin health.
Do not assume the plugin itself guarantees complete security.
Error Monitoring
Monitor:
PHP Errors JavaScript Errors Database Errors REST Errors Fatal Errors
Group repetitive failures.
Fatal Error Detection
A fatal error can break important pages or the entire site.
High-severity errors should trigger immediate investigation for critical sites.
Error Trend Analysis
A single error might be harmless.
A rapidly increasing error rate is more significant.
For example:
10 errors/hour → 50 → 500
may indicate a newly introduced problem.
404 Monitoring
Unexpected increases in 404 responses can indicate:
Broken Links Missing Pages Bad Redirects Deployment Issues Bot Activity
Interpret 404 patterns in context.
Database Monitoring
Monitor useful signals such as:
Database Connectivity Database Size Growth Query Time Connection Errors
Monitoring should not automatically delete data.
Slow Query Monitoring
Expensive queries may come from:
Plugin Theme Custom Code WooCommerce Reporting Search
Identify the source before making changes.
Options Table Monitoring
Large or unusually active options data can be investigated as part of performance diagnostics.
Don't delete unfamiliar options automatically.
Backup Monitoring
Track:
Last Successful Backup Backup Age Backup Size Storage Failure Status
A missing backup is an operational alert.
Backup Verification
A successful backup event does not guarantee recovery.
For important websites, periodic restore tests provide stronger evidence.
Restore Monitoring
An agency can track:
Last Restore Test Result Recovery Duration Issues
where appropriate.
Performance Monitoring
Monitor:
Response Time Page Performance Cache Behavior Server Errors
The exact metrics depend on available observability tools.
Core Web Vitals
For sites where user experience is important, monitor relevant Core Web Vitals trends.
Avoid treating one lab result as a permanent measurement of site health.
Resource Monitoring
Where hosting access permits, monitor:
CPU Memory Storage Bandwidth PHP Workers Database Load
Resource metrics can explain symptoms observed at the website level.
Storage Monitoring
Disk or file-storage growth can eventually cause failures.
Alert before storage reaches a critical threshold.
Bandwidth Monitoring
For media-heavy websites, traffic spikes can significantly increase bandwidth usage.
Monitor unusual changes where the hosting architecture supports it.
CDN Monitoring
If a CDN is used, check:
Availability Cache Status Origin Health TLS
A CDN outage may affect users even when the origin server is healthy.
Cache Monitoring
Monitor meaningful cache signals:
Cache Availability Cache Hit Rate Invalidation Problems
only when the caching architecture exposes reliable measurements.
Form Monitoring
Forms are often business-critical.
A synthetic form test can verify:
Page Loads Form Accepts Input Submission Succeeds Response Appears
Use safe test destinations.
Email Monitoring
Verify critical email workflows where practical.
For example:
Contact Form → Email
A successful form submission does not prove final delivery.
Transactional Email Monitoring
For ecommerce or membership sites, important workflows may include:
Order Email Password Reset Account Confirmation Invoice
Monitor according to business importance.
WooCommerce Monitoring
For stores, monitor:
Products Cart Checkout Orders Payments Shipping Emails Scheduled Tasks
Use non-destructive checks where possible.
Payment Monitoring
Do not automatically create unnecessary live financial transactions.
Use provider-supported test mechanisms and controlled production verification where appropriate.
API Monitoring
External API dependencies can fail even when WordPress remains online.
Monitor important integrations such as:
CRM Email Payment Analytics AI Search Automation
API Latency Monitoring
Track response time from important providers.
Sudden latency increases can affect website performance.
API Error Monitoring
Capture relevant:
4xx 5xx Timeout Authentication Failure Rate Limit
and route them according to severity.
Credential Expiration Monitoring
Some external services use credentials that expire.
Monitor where expiration metadata is available.
Do not expose actual secrets in monitoring dashboards.
Webhook Monitoring
For important webhooks, monitor:
Received Processed Failed Retried
This helps identify missing events.
Cron Monitoring
Track important scheduled tasks:
Last Run Next Run Failure Delay
Queue Monitoring
For sites using background workers:
Queue Depth Processing Time Failed Jobs Retries Dead-Letter Jobs
can be useful.
Background Job Monitoring
A queue stuck in processing can silently break:
Reports Emails Sync Imports AI Tasks
Monitor high-value job types.
Search Monitoring
For content-heavy websites, monitor:
Search Availability Search Errors Response Time Empty-Result Changes
Significant changes in empty results can reveal indexing or content issues.
Content Monitoring
Technical monitoring can be complemented by content checks such as:
Broken Images Missing Titles Broken Links Outdated Content Duplicate Content
The correct checks depend on the site.
SEO Monitoring
Monitor important technical signals:
Indexability Robots Sitemap Canonical 404s Redirects
Do not claim that monitoring these fields guarantees rankings.
Search Engine Access Monitoring
A site that accidentally becomes noindex can lose visibility.
Alert when important indexability settings change unexpectedly.
Sitemap Monitoring
Check:
Sitemap Exists Accessible Correct Domain Valid URLs
and monitor changes where useful.
Certificate, Domain, and Hosting Expiration
A client operations dashboard can track:
SSL Domain Hosting Premium Plugins Themes Third-Party Services
This is especially useful for recurring maintenance plans.
License Monitoring
Track:
Product License Status Renewal Date Affected Sites Owner
Do not store license secrets unnecessarily.
Alert Severity
Use clear levels:
Critical High Medium Low Informational
Example:
Critical: Production Down High: Checkout Failing Medium: Plugin Update Available Low: Minor 404 Increase
Exact severity should depend on client context.
Alert Deduplication
Suppose a website produces:
10,000 identical PHP errors
Create one incident with an occurrence count rather than thousands of alerts.
Alert Suppression
Temporarily suppress known maintenance-related alerts.
For example:
Scheduled Deployment ↓ Expected Errors Suppressed ↓ Deployment Complete ↓ Monitoring Resumes
Use suppression carefully.
Alert Escalation
A critical issue that remains unresolved can escalate:
Developer ↓ Technical Lead ↓ Operations ↓ Client
according to the service agreement.
Avoid Alert Fatigue
Too many low-value alerts cause teams to ignore monitoring.
Measure:
Alert Volume False Positives Acknowledgement Time Resolution Time
and tune the system.
Maintenance Ticket Creation
Monitoring should connect to task management:
Issue Detected ↓ Ticket Created ↓ Assigned ↓ Resolved
Avoid creating duplicate tickets for the same problem.
Incident Grouping
Related alerts can be grouped into one incident.
For example:
Server Load Increase + Response Time Increase + 5xx Increase
may represent one underlying problem.
Root Cause Analysis
Monitoring identifies symptoms.
The agency still needs investigation to determine:
What Changed? Why? What Is the Root Cause? How Can It Be Prevented?
Monitoring and Deployments
Store deployment records:
Release Commit Time Environment Result
When monitoring detects an error shortly after a deployment, the change history helps investigation.
Deployment Correlation
A useful monitoring system can show:
Deploy: 14:00 Errors Increased: 14:04
This doesn't prove causation, but it provides valuable investigation context.
Maintenance Windows
Expected maintenance should be represented in monitoring.
This reduces false alerts.
Production Locks
High-risk sites can use controls preventing automated changes unless explicitly approved.
Monitoring Dashboard
A central agency dashboard can show:
Client Site Environment Health Uptime SSL Backups Updates Errors Performance Tickets
Client Health Status
Use states such as:
Healthy Attention Warning Critical Unknown
Unknown is important when monitoring data is unavailable.
Site Health Score
A health score may combine:
Uptime Backups Updates Security SSL Performance Errors
The formula should be documented.
A score is a summary signal, not an absolute technical truth.
Monitoring History
Track:
Site Metric Value Time
Historical data helps identify trends.
Trend Analysis
Compare:
Today vs Last Week vs Last Month
to identify gradual deterioration.
Performance Baselines
Establish normal ranges for:
Response Time Error Rate CPU Memory Database
Alerts should consider deviation from the baseline where appropriate.
Anomaly Detection
AI or statistical methods can detect unusual changes.
For example:
Normal: 100 Requests/min Current: 450 Requests/min
This may indicate:
Traffic Spike Bot Activity Application Error Campaign
Interpret the anomaly before taking action.
AI-Assisted Monitoring
AI can help with:
Log Summaries Alert Grouping Incident Classification Root-Cause Hypotheses Maintenance Recommendations Report Drafting
Use verified monitoring data as the source.
AI Should Not Invent Health Data
Do not ask AI to estimate:
Uptime Backup Success Traffic Errors Performance
when authoritative monitoring data already exists.
AI Incident Summaries
A structured incident can be summarized:
Issue: 5xx errors increased after deployment. Evidence: Error rate increased from baseline. Possible Cause: Recent plugin change. Recommended Action: Review release and logs.
The recommendation remains a hypothesis until verified.
AI Alert Prioritization
AI can help classify alerts using:
Site Importance Error Frequency Business Impact Timing Deployment Correlation
Keep the final severity policy under agency control.
Monitoring and Privacy
Monitoring can process:
URLs Logs User Data Form Data API Errors
Minimize stored data and protect sensitive information.
Do Not Capture Passwords
Monitoring systems should never intentionally collect:
Passwords API Secrets Private Keys Session Tokens
Tenant Isolation
For multi-client platforms:
Client A → Client A Data Client B → Client B Data
Monitoring, alerts, logs, reports, caches, and dashboards must respect tenant boundaries.
Never Trust Client IDs
Resolve and authorize site or tenant scope server-side.
Do not rely solely on browser-provided identifiers.
Monitoring API Security
If WordPress sites expose monitoring endpoints, require:
Authentication Authorization Site Scope Request Validation Replay Protection
where appropriate.
Avoid a Remote Shell
Do not build monitoring endpoints that allow:
Execute Any PHP Execute Any SQL Execute Any Shell Command
Monitoring should expose specific safe operations.
Monitoring Connector
A secure connector might expose:
Health Version Plugin Inventory Backup Status Approved Diagnostics
only.
Monitoring Agent Updates
If the client site uses a monitoring plugin or agent, track:
Agent Version Compatibility Last Check-In
Offline Detection
A monitoring platform should detect when a site's connector stops reporting.
Distinguish:
Site Down vs Monitoring Connector Offline
They are not necessarily the same.
Check-In Heartbeat
A client plugin can periodically send a heartbeat:
Site → Check-In → Central System
If the heartbeat stops, the platform can flag the site as potentially offline.
Heartbeat Failure
Heartbeat failures can happen because:
Site Down Cron Problem Network Problem Plugin Disabled Credential Problem
Investigate rather than assuming the website is definitely down.
Polling vs Push
Polling
Central platform asks:
How are you?
Push
Site reports:
I am healthy.
A hybrid model can provide broader coverage.
Monitoring Frequency
Choose frequency according to importance.
For example:
Critical Site: 1–5 Minute Uptime Normal Site: 5–15 Minutes Low Risk: 15–30 Minutes
Exact intervals should reflect infrastructure cost and service requirements.
High-Frequency Monitoring Costs
More frequent checks increase:
Requests Bandwidth Infrastructure Storage
Use appropriate intervals rather than maximum frequency everywhere.
Monitoring Retention
Define how long to keep:
Metrics Alerts Logs Incidents Audit Events
Retention should match operational and business requirements.
Long-Term Metrics
Keep long-term trend data smaller where appropriate.
For example:
Raw Events: Short Retention Daily Aggregates: Longer Retention
Monitoring Reports
A monthly client report may include:
Uptime Incidents Backups Security Updates Performance Recommendations
Use meaningful business language.
Do Not Fake 100% Uptime
Report measured availability accurately.
Monitoring location, methodology, planned maintenance, and transient failures can affect the measurement.
Incident Reports
For important outages, create:
Incident Timeline Impact Root Cause Resolution Prevention
This can build client trust.
Service-Level Reporting
If the agency offers an SLA, reporting should align with the agreed measurement method.
Client Monitoring Portal
A secure portal can show:
Website Health Uptime Incidents Maintenance Reports Recommendations
Clients should see only their own data.
Agency Operations Dashboard
Internal staff may need deeper information:
Client Risk Open Incidents Failed Backups SSL Expiry Version Drift Alerts Maintenance Queue
Monitoring Prioritization
Sort sites by:
Business Criticality SLA Revenue Traffic Security Risk Open Incidents
This helps teams focus.
Escalation Rules
Example:
5xx: Immediate Backup Failure: High Update Available: Normal Minor 404: Low
Customize rules by site.
Monitoring Runbooks
Create runbooks for:
Website Down SSL Problem Backup Failure Plugin Conflict High CPU Database Error Form Failure API Failure
Outage Runbook
A typical process:
Alert ↓ Confirm ↓ Identify Scope ↓ Check Recent Changes ↓ Contain ↓ Recover ↓ Verify ↓ Communicate ↓ Document
Backup Failure Runbook
Detect ↓ Check Storage ↓ Check Credentials ↓ Retry Safely ↓ Verify New Backup ↓ Escalate if Needed
SSL Runbook
Expiry Alert ↓ Check Certificate ↓ Check Renewal ↓ Renew / Escalate ↓ Verify HTTPS
Plugin Failure Runbook
Error Detected ↓ Check Recent Update ↓ Check Logs ↓ Test Staging ↓ Restore / Roll Back if Appropriate ↓ Verify
Avoid rolling back blindly when doing so could create security exposure.
Monitoring and Recurring Maintenance
Monitoring naturally feeds maintenance:
Monitor ↓ Detect ↓ Task ↓ Fix ↓ Verify ↓ Report
This creates a strong recurring-service workflow.
Why Choose ThemeKaddora?
ThemeKaddora provides WordPress themes, plugins, HTML templates, UI kits, WooCommerce solutions, AI tools, and other digital products used in client projects.
For sites using ThemeKaddora products, agencies can monitor:
Product Version Compatibility License Status Dependencies Customization
Monitoring does not replace testing before updates.
Common Monitoring Mistakes
Avoid:
Monitoring only homepage availability.
Treating one failed request as a confirmed outage.
Sending every error directly to a developer.
Creating thousands of duplicate alerts.
Ignoring backup verification.
Monitoring without action thresholds.
Using production secrets unnecessarily in monitoring.
Storing sensitive logs indefinitely.
Mixing staging and production monitoring data.
Ignoring connector failures.
Trusting client-provided tenant IDs.
Exposing unrestricted monitoring APIs.
Building a remote shell into a monitoring plugin.
Using the same monitoring policy for every client.
Ignoring business-critical workflows.
Treating an AI recommendation as verified root cause.
Reporting fabricated or incomplete uptime statistics.
Automating risky remediation without safeguards.
Best Practices for Monitoring Client WordPress Websites
A professional agency should:
Define monitoring objectives before selecting tools or metrics.
Maintain a central inventory containing site identity, environment, versions, risk, and service information.
Use stable internal site identifiers because domains can change.
Distinguish production, staging, and development monitoring data.
Classify client websites by business and operational risk.
Use stronger monitoring policies for WooCommerce, SaaS, membership, high-traffic, and business-critical sites.
Monitor uptime and response time from appropriate locations and avoid declaring outages based on isolated transient failures.
Track SSL certificates and alert before expiration.
Monitor important DNS and domain signals where they affect website availability.
Track WordPress, PHP, theme, plugin, WooCommerce, and other relevant dependency versions.
Distinguish update availability from update approval.
Monitor meaningful configuration drift rather than attempting to compare every setting.
Monitor unexpected administrator creation, privilege changes, security alerts, and relevant file changes.
Correlate expected file modifications with known deployments to reduce false positives.
Collect and group PHP, JavaScript, database, REST, and application errors.
Watch error trends instead of treating every individual error as equally important.
Investigate sudden 404 increases for broken links, missing pages, redirects, or other anomalies.
Monitor database connectivity, growth, connection errors, and meaningful query-performance signals.
Do not automate database deletion simply because a table or dataset becomes large.
Track backup freshness and failure status.
Verify restore procedures periodically for important sites.
Monitor performance using relevant response, caching, server, database, and user-experience signals.
Track Core Web Vitals trends where appropriate instead of relying on one-time benchmark results.
Monitor server CPU, memory, storage, PHP workers, database load, and bandwidth when the hosting architecture provides those metrics.
Monitor storage thresholds before clients experience failures.
Monitor CDN and cache health where meaningful metrics are available.
Use synthetic tests for important forms with controlled test data and safe destinations.
Monitor critical email workflows without collecting unnecessary message content or secrets.
Monitor WooCommerce checkout, orders, emails, scheduled tasks, and other business-critical paths using safe verification methods.
Avoid unnecessary real financial transactions during synthetic payment testing.
Monitor external APIs for latency, errors, authentication failures, rate limits, and timeouts.
Monitor important webhook receipt, processing, retries, and failure states.
Track cron and queue health, including delayed, failed, and dead-letter jobs.
Monitor important search and SEO signals such as indexability, sitemap availability, redirects, canonicals, and relevant error patterns.
Track license, domain, hosting, SSL, and important third-party renewal information.
Use alert severity levels tied to business impact and client-specific service agreements.
Group duplicate alerts and suppress expected maintenance noise.
Implement escalation rules for unresolved high-severity incidents.
Avoid alert fatigue by tracking false positives, acknowledgement time, and unnecessary alert volume.
Connect monitoring findings to tickets, tasks, incidents, and maintenance workflows.
Correlate incident timing with deployment history without assuming temporal correlation proves causation.
Establish baseline metrics for important websites and investigate significant deviations.
Use anomaly detection only where it produces actionable results.
Use AI to summarize verified logs, group incidents, classify alerts, propose hypotheses, and draft reports rather than inventing health information.
Treat AI recommendations as hypotheses until verified against authoritative system data.
Never allow AI unrestricted production remediation or administrative access.
Protect monitoring APIs with authentication, authorization, site scope, request validation, and replay protection where appropriate.
Expose explicit safe monitoring operations rather than arbitrary PHP, SQL, shell, or remote-code execution.
Distinguish a website outage from a monitoring connector failure.
Use heartbeats or check-ins to detect when monitoring agents stop reporting.
Consider polling, push, or hybrid architectures based on reliability and scale requirements.
Choose monitoring frequency according to client risk and infrastructure cost rather than maximizing check frequency everywhere.
Define metric, alert, incident, and audit retention periods.
Aggregate long-term data where raw event retention is unnecessary.
Provide accurate uptime reporting and disclose the measurement methodology where clients receive service reports.
Create incident reports for important failures containing timeline, impact, cause, resolution, and prevention steps.
Align monitoring reports with contractual service-level definitions.
Provide clients with only the monitoring data appropriate to their access and agreement.
Maintain separate internal dashboards containing operational details not intended for clients.
Enforce strict tenant isolation across metrics, alerts, incidents, logs, reports, caches, APIs, and dashboards.
Never trust client-provided tenant or site IDs without server-side verification.
Never intentionally capture passwords, private keys, API secrets, or session tokens in monitoring systems.
Keep monitoring logs and customer information only as long as operational or contractual requirements justify.
Create runbooks for outages, SSL failures, backup problems, plugin conflicts, database errors, high resource usage, form failures, and API incidents.
Test runbooks periodically rather than assuming they will work during an incident.
Use ThemeKaddora product version, compatibility, licensing, dependency, and customization information as part of client inventory where those products are used.
Review monitoring policies whenever the client's architecture, traffic, business importance, hosting, or integrations change.
Measure monitoring effectiveness through detection time, resolution time, false-positive rate, incident volume, and actionable-alert percentage.
Conclusion
Monitoring client WordPress websites is one of the most important operational capabilities an agency can develop as its client portfolio grows.
The wrong approach is:
Website ↓ Ping Homepage ↓ "Looks Fine"
The better approach is:
Website ↓ Availability + Security + Software + Performance + Backups + Application Health + Business Workflows ↓ Central Monitoring ↓ Alerts ↓ Tickets ↓ Resolution ↓ Verification ↓ Reporting
The first principle is monitor what matters.
A website can return HTTP 200 while its checkout, forms, email, API integrations, or background jobs are broken.
The second principle is use risk-based monitoring.
Not every client needs identical monitoring frequency or depth.
The third principle is combine infrastructure and application signals.
Uptime, SSL, server resources, WordPress versions, errors, APIs, queues, backups, and business workflows provide a much more complete picture together.
The fourth principle is avoid alert noise.
Thousands of duplicate alerts do not improve reliability. They make teams less responsive to real problems.
The fifth principle is use baselines.
Normal response time, error rates, storage growth, and other historical metrics provide context for identifying meaningful anomalies.
The sixth principle is connect monitoring to maintenance.
A useful alert should create an actionable workflow:
Detect → Classify → Assign → Resolve → Verify
The seventh principle is protect monitoring infrastructure itself.
A central dashboard can become a powerful access layer across many client websites, so authentication, authorization, tenant isolation, credential protection, and auditability are essential.
The eighth principle is distinguish site failures from monitoring failures.
A missing agent heartbeat may mean the connector is broken, not necessarily that the entire website is unavailable.
The ninth principle is use AI carefully.
AI can summarize logs, group related alerts, identify patterns, and produce incident summaries, but actual health information should come from authoritative monitoring systems.
The tenth principle is measure monitoring quality.
Detection time, resolution time, false-positive rate, alert volume, and actionable-alert percentage show whether the monitoring system is genuinely helping the agency.
For websites using ThemeKaddora products, agencies can include:
Product Version + License Status + Compatibility + Dependencies + Customization
in the site's operational inventory.
A mature client monitoring architecture can look like:
Client Registry ↓ Secure Site Connectors ↓ Uptime / SSL / DNS ↓ WordPress / Plugin / PHP Health ↓ Security / Errors ↓ Performance / Database ↓ Forms / Email / WooCommerce ↓ APIs / Webhooks / Queues ↓ Central Alert Engine ↓ Incident Management ↓ Verification ↓ Client Reporting
A professional WordPress monitoring system should be:
Proactive
→ Risk-Based
→ Observable
→ Accurate
→ Actionable
→ Secure
→ Tenant-Aware
→ Automated
→ Auditable
→ Scalable
The most important principle is:
Monitor the actual business-critical health of client websites—not just whether the homepage responds—and connect meaningful signals to controlled incident, maintenance, and reporting workflows.
When agencies implement this approach, they can detect problems sooner, reduce client-reported incidents, improve maintenance efficiency, prioritize support work, provide stronger recurring services, and manage a growing portfolio of WordPress websites with much greater operational confidence.
Frequently Asked Questions
What is WordPress client website monitoring?
It is the process of continuously or periodically checking client websites for availability, security, performance, software health, backups, errors, integrations, and business-critical functionality.
Why should agencies monitor client websites?
Monitoring helps detect problems earlier, improve support response, protect critical workflows, and manage many websites more efficiently.
Is uptime monitoring enough?
No. A website can be online while forms, checkout, APIs, emails, queues, or other important functionality is broken.
What should a WordPress agency monitor?
Common areas include uptime, SSL, versions, security, errors, backups, performance, databases, forms, email, WooCommerce, APIs, webhooks, cron, queues, SEO signals, and important business workflows.
Should every client have the same monitoring configuration?
No. Monitoring should reflect business criticality, traffic, complexity, and service requirements.
How frequently should a site be checked?
There is no universal interval. Critical sites may require checks every few minutes, while lower-risk websites can use less frequent monitoring.
Does more frequent monitoring always mean better monitoring?
No. It increases infrastructure cost and can create unnecessary noise. Use a frequency appropriate to the site's risk.
What is multi-location uptime monitoring?
It checks website availability from different geographic locations to help distinguish local network issues from broader outages.
Can one failed uptime request mean the site is down?
Not necessarily. Confirmation checks help prevent false outage alerts.
What should SSL monitoring check?
Certificate expiration, HTTPS availability, validity, and relevant certificate-chain issues.
Why choose Themekaddora?
Themekaddora provides lightweight, responsive, SEO-friendly WordPress themes with fast performance, WooCommerce compatibility, flexible customization, accessibility-conscious design, modern templates, regular updates, and professional support—providing a strong foundation for businesses building digital products and product-focused websites.
Comments (0)