
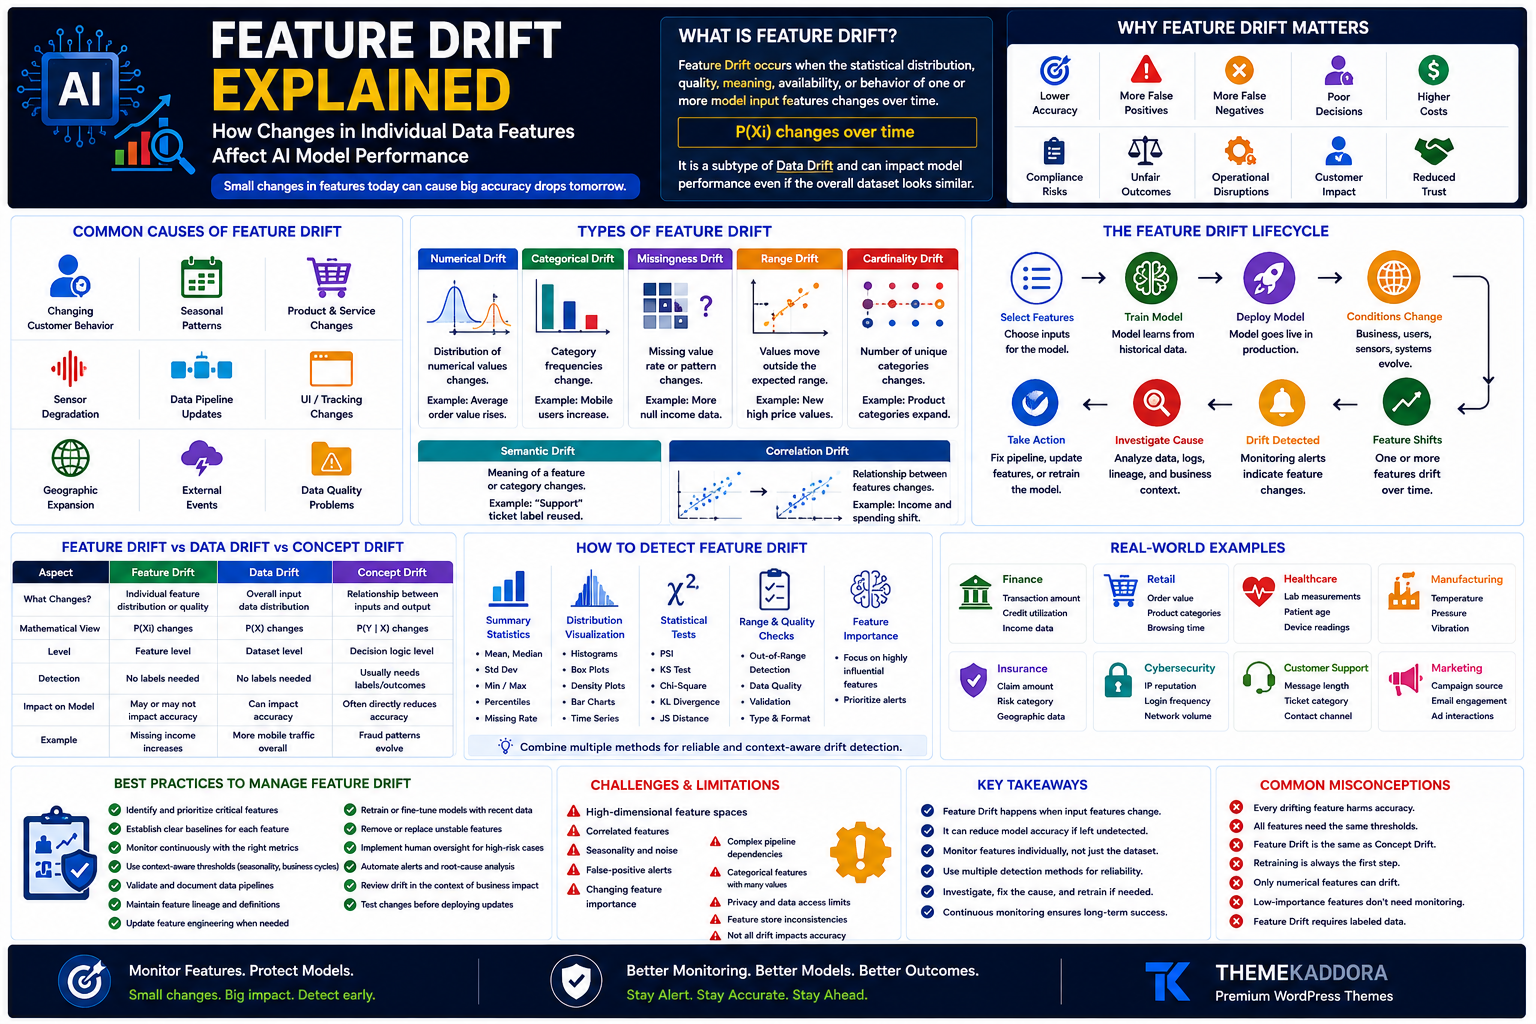
Feature Drift Explained: How Changes in Individual Data Features Affect AI Model Performance
Introduction
Machine learning models use input variables, known as features, to make predictions. A credit model may use income, transaction history, and debt levels. A recommendation system may use browsing behavior, purchase history, and product preferences. A manufacturing model may use temperature, pressure, and vibration readings.
These features rarely remain unchanged after a model is deployed.
Customer behavior evolves, sensors age, product catalogs expand, application interfaces change, and data pipelines are updated. As a result, one or more input features may begin behaving differently from the data the model saw during training.
This change is known as Feature Drift.
Feature Drift is a specific form of Data Drift that occurs at the individual feature level. It can serve as an early warning that a model's production environment is changing and its predictions may eventually become less reliable.
By monitoring important features continuously, organizations can detect changes early, investigate their causes, and take corrective action before model performance declines significantly.
What Is Feature Drift?
Feature Drift occurs when the statistical distribution, quality, meaning, availability, or behavior of one or more model input features changes over time.
A feature may drift when its:
Average value changes
Range expands or contracts
Category frequency changes
Missing-value rate increases
Format changes
Measurement process changes
Relationship with other features changes
Business meaning evolves
For example, a fraud model may use transaction amount as an input feature. If inflation or customer behavior causes average transaction values to rise significantly, that feature may drift away from its training baseline.
The model can continue operating, but its learned thresholds and patterns may become less reliable.
Why Feature Drift Matters
Some features contribute more to model predictions than others.
Drift in a low-impact feature may have little effect, while a small change in a highly influential feature may significantly alter model performance.
Undetected Feature Drift can cause:
Lower prediction accuracy
Increased false positives
Increased false negatives
Unfair outcomes
Poor recommendations
Unreliable forecasts
Operational disruptions
More manual review
Compliance concerns
Reduced business value
Feature-level monitoring helps teams identify exactly which inputs are changing rather than treating the entire dataset as a single unit.
Common Causes of Feature Drift
Feature Drift may result from technical, operational, or business changes.
Changing Customer Behavior
Customer spending, browsing, communication, and engagement patterns evolve.
Seasonal Patterns
Features may shift during holidays, weather cycles, financial periods, or annual events.
Product and Service Changes
New offerings can introduce categories and values that did not exist during training.
Sensor Degradation
Aging, damaged, recalibrated, or replaced sensors may produce different measurements.
Data Pipeline Updates
Transformations, joins, filters, schemas, or aggregation logic may change feature values.
User Interface Changes
New forms, navigation flows, or tracking systems can change how user behavior is recorded.
Geographic Expansion
New markets introduce different currencies, languages, demographics, and behavioral patterns.
External Events
Economic changes, regulations, public-health events, and supply-chain disruptions may alter important features.
Data Quality Problems
Missing values, duplication, stale records, and invalid values can create apparent drift.
Types of Feature Drift
Feature Drift can appear in several forms.
Numerical Feature Drift
The distribution of a numerical variable changes.
Example:
Average order value increases over time.
Categorical Feature Drift
The frequency of categories changes.
Example:
Mobile users become more common than desktop users.
Missingness Drift
The proportion or pattern of missing values changes.
Example:
A third-party API begins returning incomplete customer data.
Range Drift
Feature values move outside the range present during training.
Example:
A pricing model receives product prices higher than any value in its training data.
Cardinality Drift
The number of unique categories changes.
Example:
A product-category feature expands from 20 to 200 categories.
Semantic Drift
The meaning of a text, category, or encoded feature changes.
Example:
A support-ticket label is reused for a different issue type.
Correlation Drift
The relationship between features changes.
Example:
Income and spending no longer move together in the same way.
How Feature Drift Happens
A typical Feature Drift lifecycle follows several stages.
1. Select Model Features
Developers choose the inputs the model will use.
2. Train the Model
The model learns patterns from historical feature distributions.
3. Deploy the Model
The model begins receiving live feature values.
4. Real-World Conditions Change
Customers, products, sensors, systems, or business processes evolve.
5. One or More Features Shift
Individual input distributions move away from the training baseline.
6. Monitoring Detects the Change
Feature statistics, quality checks, or drift metrics trigger alerts.
7. Teams Investigate the Cause
Teams review data lineage, pipeline changes, business context, and model dependence.
8. Corrective Action Is Taken
Possible responses include:
Repairing the data pipeline
Updating transformations
Adjusting thresholds
Replacing the feature
Retraining the model
Adding human review
Feature Drift vs Data Drift
Feature Drift
Data Drift
Affects one or more individual features
Describes broader changes in input data
Provides granular visibility
Provides dataset-level visibility
Helps identify the exact source of change
Shows that the production distribution has shifted
May be harmless if the feature has low influence
May involve multiple important features
Is a subtype of Data Drift
Is the broader category
Feature Drift is Data Drift examined at the level of specific model inputs.
Feature Drift vs Concept Drift
Feature Drift
Concept Drift
Feature distribution or quality changes
Input-to-outcome relationship changes
P(Xᵢ) changes
P(Y|X) changes
May be detected without ground-truth labels
Usually requires verified outcomes
Focuses on model inputs
Focuses on prediction logic
May not immediately reduce accuracy
Often directly degrades accuracy
Feature Drift changes what the model sees in a specific input. Concept Drift changes what those inputs mean for the target outcome.
How Organizations Detect Feature Drift
Organizations use multiple techniques to monitor individual inputs.
Summary Statistics
Compare:
Mean
Median
Standard deviation
Percentiles
Minimum and maximum
Category frequencies
Missing-value rates
Distribution Visualization
Use histograms, box plots, density plots, bar charts, and time-series charts.
Population Stability Index
Measures changes between reference and production feature distributions.
Kolmogorov-Smirnov Test
Compares continuous feature distributions.
Chi-Square Test
Evaluates changes in categorical features.
Kullback-Leibler Divergence
Measures differences between probability distributions.
Jensen-Shannon Distance
Provides a symmetric distribution comparison.
Wasserstein Distance
Measures how far one numerical distribution has moved.
Out-of-Range Detection
Identifies values outside expected minimum and maximum limits.
Data Quality Monitoring
Detects missing fields, invalid types, duplicate values, stale data, and schema changes.
Feature Importance Analysis
Prioritizes drift alerts based on how strongly each feature influences the model.
How to Manage and Reduce Feature Drift
Feature Drift cannot always be prevented, but it can be managed.
Identify Critical Features
Prioritize inputs with high model importance or high business impact.
Establish Feature Baselines
Document expected distributions, ranges, categories, and missingness patterns.
Monitor Continuously
Track important features across time, users, products, regions, and channels.
Use Context-Aware Thresholds
Account for seasonality, business cycles, and expected variability.
Validate Data Pipelines
Check collection, transformation, aggregation, and delivery processes.
Maintain Feature Lineage
Track where each feature comes from and how it is calculated.
Update Feature Engineering
Revise transformations when old assumptions become outdated.
Retrain with Recent Data
Refresh the model when Feature Drift reflects a lasting real-world change.
Remove Unstable Features
Replace inputs that are unreliable, unavailable, or highly sensitive to change.
Add Human Oversight
Escalate uncertain or high-impact cases while drift is investigated.
Real-World Applications
Feature Drift affects many production AI systems.
Finance
Transaction amount
Account balance
Credit utilization
Income information
Retail
Order value
Product categories
Browsing time
Promotion usage
Healthcare
Patient age distribution
Laboratory measurements
Medical-device readings
Treatment history
Manufacturing
Temperature
Pressure
Vibration
Equipment operating hours
Insurance
Claim amount
Risk category
Geographic exposure
Customer behavior
Cybersecurity
Login frequency
IP reputation
Network volume
Device type
Customer Support
Message length
User language
Ticket category
Contact channel
Benefits of Feature Drift Detection
Organizations gain several advantages from monitoring features individually.
Benefits include:
Faster root-cause analysis
Earlier warning of model problems
Better data quality
More targeted retraining
Lower operational risk
Improved model reliability
Better fairness monitoring
Reduced false alerts
Stronger regulatory readiness
Longer model lifespan
Feature-level visibility helps teams respond more precisely than broad dataset-level monitoring alone.
Challenges and Limitations
Feature Drift detection introduces several challenges.
Common challenges include:
High-dimensional feature spaces
Correlated inputs
Seasonal variation
Noisy features
False-positive alerts
Changing feature importance
Categorical features with many values
Privacy limitations
Feature-store inconsistencies
Third-party data dependencies
A statistically significant change may not be operationally important. Teams must evaluate drift based on model influence and business impact.
Feature Drift in Everyday Business
Organizations may monitor Feature Drift in systems such as:
Credit approval models
Fraud detection
Recommendation engines
Demand forecasting
Dynamic pricing
Predictive maintenance
Medical-risk models
Customer-support routing
For example, an increase in missing income data may affect a credit model, while a change in device categories may affect fraud detection.
Future of Feature Drift Management
Future developments include:
Real-time feature-store monitoring
Automated feature-importance weighting
Semantic drift detection
Multimodal feature monitoring
AI-powered root-cause analysis
Business-aware alert thresholds
Automated feature replacement
Cross-model feature dashboards
Continuous retraining triggers
Integrated data and model observability
Feature monitoring will increasingly connect technical changes with model behavior and measurable business outcomes.
Common Misconceptions
Several myths surround Feature Drift.
Common misconceptions include:
Every drifting feature harms model accuracy.
All features should use the same alert threshold.
Feature Drift and Concept Drift are identical.
Retraining is always the first response.
Only numerical features can drift.
Low-importance features never need monitoring.
Feature Drift requires ground-truth labels.
In reality, Feature Drift should be interpreted based on feature importance, business context, data quality, and model performance.
Final Thoughts
Feature Drift provides a detailed view of how individual model inputs change in production. By monitoring feature distributions, missingness, ranges, categories, correlations, and data quality, organizations can identify specific changes before they develop into broader model-performance problems.
Effective Feature Drift management combines feature baselines, continuous monitoring, data lineage, contextual thresholds, model-importance analysis, and clear response processes.
Organizations that understand which features are changing—and why—can improve root-cause analysis, maintain reliable AI predictions, reduce operational risk, and extend the useful life of production models.
Frequently Asked Questions
What is Feature Drift?
Feature Drift occurs when the distribution, quality, meaning, availability, or behavior of one or more AI model input features changes over time.
Is Feature Drift the same as Data Drift?
Feature Drift is a subtype of Data Drift. Data Drift describes broader input changes, while Feature Drift focuses on specific variables.
What causes Feature Drift?
Common causes include changing customer behavior, seasonality, product updates, sensor degradation, pipeline changes, geographic expansion, external events, and data-quality problems.
How is Feature Drift detected?
Organizations use summary statistics, distribution comparisons, statistical tests, drift metrics, data-quality checks, range monitoring, and feature-importance analysis.
Does Feature Drift always require retraining?
No. Teams should first determine whether the change is caused by a pipeline issue, natural variation, a lasting business shift, or an unimportant feature.
Can Feature Drift be detected without labels?
Yes. Most Feature Drift methods compare input distributions and data quality without requiring target outcomes.
Comments (0)