
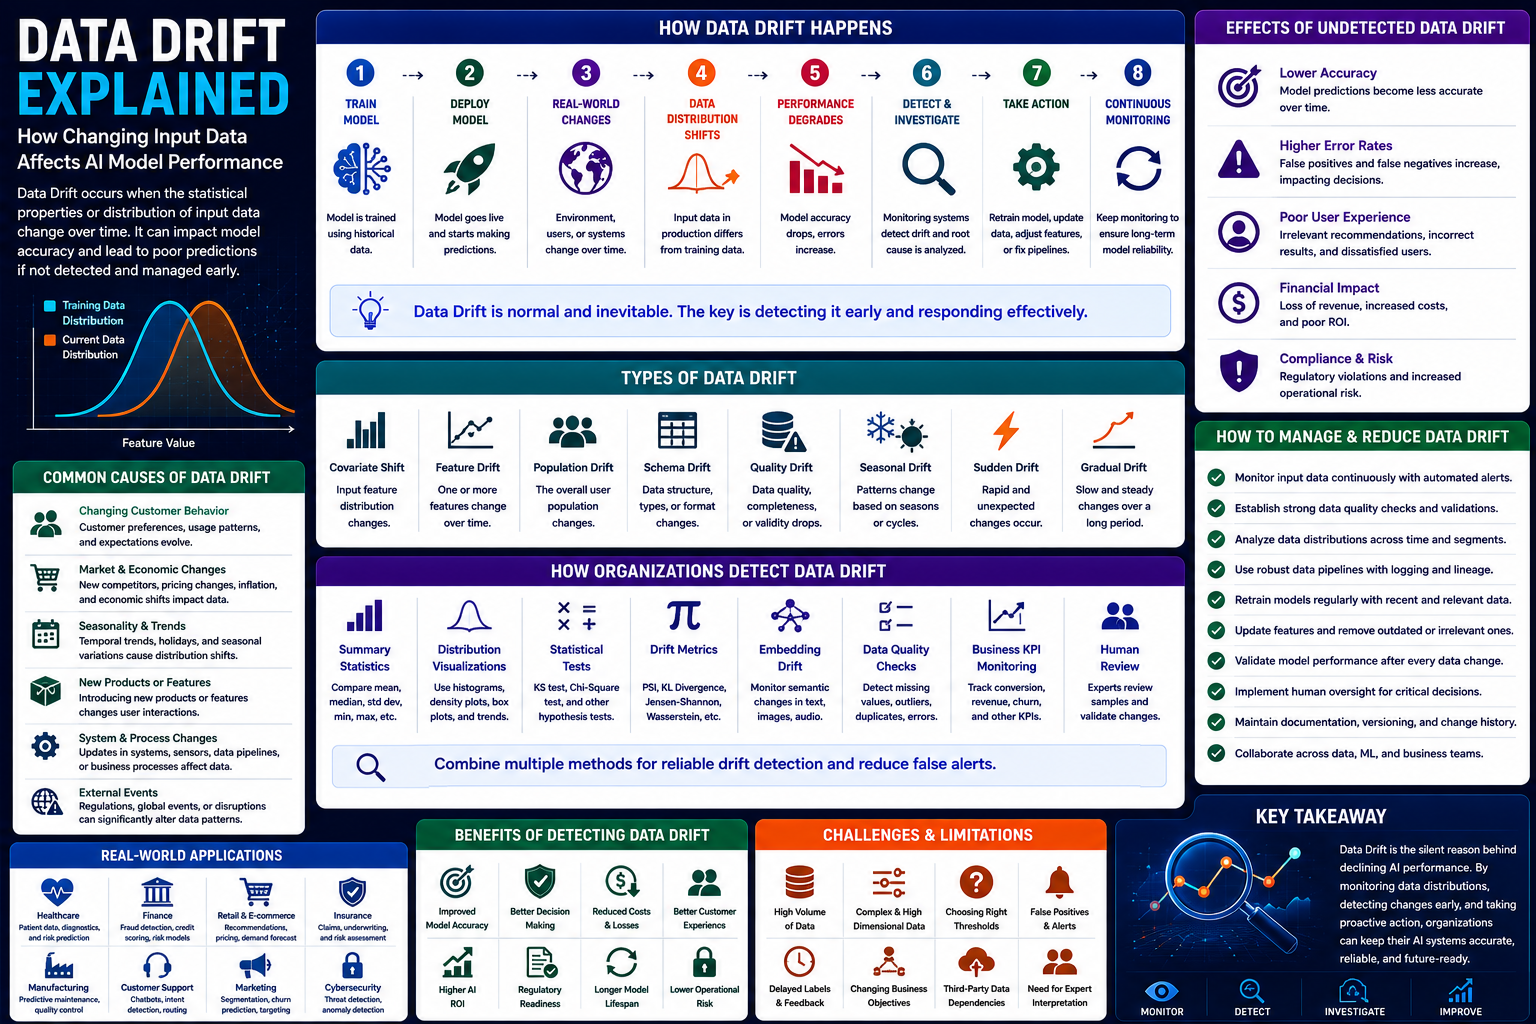
Data Drift Explained: How Changing Input Data Affects AI Model Performance
Introduction
Artificial Intelligence and machine learning models learn patterns from historical data. During development, teams assume that the data a model receives after deployment will remain reasonably similar to the data used for training.
However, production environments continuously change.
Customer preferences evolve, new products are introduced, sensors are replaced, economic conditions shift, fraud patterns change, and users begin interacting with applications in new ways. These changes can alter the characteristics and statistical distribution of input data.
This phenomenon is known as Data Drift.
Data Drift does not automatically mean a model has failed, but it can be an early warning that its assumptions may no longer match current conditions. When ignored, it may contribute to declining accuracy, unreliable predictions, unfair outcomes, and wider Model Drift.
Continuous data monitoring helps organizations identify these changes before they significantly affect customers or business operations.
What Is Data Drift?
Data Drift occurs when the statistical distribution, structure, quality, or characteristics of production input data change compared with the data used to train or validate an AI model.
In mathematical terms, Data Drift often refers to a change in the distribution of input variables:
P(X) changes over time
Here, X represents the input features used by the model.
Examples include:
Customers becoming younger or older on average
Transaction amounts increasing
Product categories changing
Sensor readings shifting
Website traffic moving from desktop to mobile
New vocabulary appearing in customer messages
Seasonal demand patterns changing
The model may continue generating predictions, but those predictions may become less dependable if the new data differs significantly from its training experience.
Why Data Drift Matters
Data is the foundation of every AI model.
When production inputs change, organizations may experience:
Reduced prediction accuracy
Higher false-positive rates
Higher false-negative rates
Poor recommendations
Unreliable forecasts
Increased bias
More manual review
Customer dissatisfaction
Regulatory concerns
Reduced business value
Detecting Data Drift helps teams determine when a model requires investigation, validation, retraining, or replacement.
Common Causes of Data Drift
Data Drift can result from many technical and business changes.
Changing Customer Behavior
Purchasing patterns, preferences, communication styles, and digital habits naturally evolve.
Seasonal Changes
Demand may shift during holidays, weather cycles, school terms, or financial periods.
Market Conditions
Inflation, competition, supply chains, and economic events can change production data.
New Products and Services
Launching new offerings may introduce values that were not present during training.
Technology Changes
Application updates, device changes, sensors, tracking systems, or APIs may alter how data is collected.
Data Pipeline Changes
Schema updates, transformations, missing fields, and software errors may modify input data.
Geographic Expansion
Entering new markets can introduce new languages, currencies, behaviors, and demographics.
External Events
Natural disasters, public-health events, policy changes, or geopolitical disruptions may create sudden distribution shifts.
Fraud and Threat Evolution
Attackers deliberately change behavior to avoid detection by existing models.
Types of Data Drift
Data Drift can appear in several forms.
Covariate Shift
The distribution of input features changes while the relationship between inputs and outputs remains relatively stable.
Feature Drift
One or more individual features change over time.
Population Drift
The composition of users, customers, devices, or entities changes.
Schema Drift
The structure, names, types, or format of incoming data changes.
Quality Drift
The completeness, accuracy, consistency, or validity of data declines.
Seasonal Drift
Input patterns change predictably based on recurring cycles.
Sudden Drift
A rapid event causes an immediate change in data distribution.
Gradual Drift
Input patterns slowly evolve over an extended period.
How Data Drift Happens
A typical Data Drift lifecycle looks like this.
1. Train the Model
The model learns from historical data representing a particular period and environment.
2. Deploy the Model
The model begins receiving live production inputs.
3. Real-World Conditions Change
Customers, markets, products, systems, or external conditions evolve.
4. Input Distribution Shifts
Production data becomes different from training data.
5. Monitoring Detects Changes
Statistical tests or monitoring systems identify unusual feature distributions.
6. Teams Investigate
Teams use data lineage, logs, business context, and AI Observability to understand the cause.
7. Corrective Action Is Taken
Organizations may:
Repair a data pipeline
Update transformations
Retrain the model
Add new features
Change thresholds
Segment the model
Add human review
8. Monitoring Continues
Teams confirm that the response restored stable and reliable performance.
Data Drift vs Model Drift
Data Drift
Model Drift
Input data distribution changes
Model performance declines
Can occur before accuracy drops
Usually measured through prediction quality
Focuses on production data
Focuses on model outcomes
May not immediately harm performance
Indicates the model is becoming less effective
Can be a cause of Model Drift
Can result from Data Drift or Concept Drift
Data Drift is a warning signal. Model Drift describes the broader deterioration of model effectiveness.
Data Drift vs Concept Drift
Data Drift
Concept Drift
P(X) changes
P(Y|X) changes
Input distribution changes
Input-to-outcome relationship changes
May be detected without ground-truth labels
Often requires outcome labels
Example: transaction amounts increase
Example: fraudsters change strategies
Model may remain accurate temporarily
Existing decision logic may become outdated
Data Drift changes what the model sees. Concept Drift changes what the data means for the prediction task.
How Organizations Detect Data Drift
Organizations use several techniques.
Summary Statistics
Compare:
Mean
Median
Standard deviation
Minimum and maximum
Missing-value rates
Category frequencies
Distribution Visualization
Use histograms, box plots, density plots, and time-series charts to compare training and production data.
Population Stability Index
Measures how much a variable's distribution has changed.
Kullback-Leibler Divergence
Measures the difference between probability distributions.
Jensen-Shannon Distance
Provides a symmetric and bounded distribution comparison.
Wasserstein Distance
Measures how far one distribution must move to match another.
Kolmogorov-Smirnov Test
Compares continuous data distributions.
Chi-Square Test
Compares categorical feature distributions.
Embedding Drift
Tracks semantic changes in text, images, audio, or multimodal embeddings.
Data Quality Checks
Detect schema changes, missing fields, invalid values, and pipeline failures.
How to Manage and Reduce Data Drift
Organizations can manage drift through layered operational practices.
Establish Baselines
Document expected feature distributions using training and historical production data.
Monitor Continuously
Track critical features, segments, schemas, and data-quality metrics.
Set Appropriate Thresholds
Define warning and critical thresholds based on business impact rather than arbitrary values.
Segment the Data
Analyze drift across regions, customer groups, products, devices, or channels.
Validate the Data Pipeline
Check transformations, schemas, integrations, and collection systems.
Retrain with Recent Data
Refresh the model when new data reflects lasting changes.
Use Rolling Training Windows
Train on recent periods when older data is no longer representative.
Add Human Review
Escalate high-impact or uncertain decisions while drift is investigated.
Maintain Data Lineage
Track where data originated and how it was transformed.
Document Responses
Record detected drift, root causes, decisions, and corrective actions.
Real-World Applications
Data Drift affects AI systems across many industries.
Finance
Transaction amounts
Customer income patterns
Market volatility
Fraud behavior
Retail
Product demand
Shopping channels
Customer demographics
Pricing patterns
Healthcare
Patient populations
Disease prevalence
Diagnostic equipment
Treatment protocols
Manufacturing
Sensor readings
Equipment conditions
Raw materials
Production environments
Insurance
Claim patterns
Risk profiles
Geographic exposure
Customer behavior
Cybersecurity
Network traffic
Malware signatures
Attack techniques
User-access behavior
Customer Support
User vocabulary
Contact reasons
Product issues
Communication channels
Benefits of Data Drift Detection
Organizations gain several advantages by detecting Data Drift early.
Benefits include:
Earlier warning of model problems
Better prediction reliability
Improved data quality
Faster root-cause analysis
Lower operational risk
Reduced financial losses
Better customer experiences
Stronger regulatory readiness
More efficient retraining
Longer model lifespan
Data Drift monitoring helps teams act before model performance declines significantly.
Challenges and Limitations
Data Drift detection is not always straightforward.
Common challenges include:
High-dimensional datasets
Correlated features
Natural seasonal changes
False-positive alerts
Incomplete training baselines
Large data volumes
Delayed business context
Third-party data limitations
Privacy restrictions
Choosing meaningful thresholds
A statistical change may be harmless, while a small shift in a critical feature may have significant consequences. Teams must interpret drift in context.
Data Drift in Everyday Business
Many organizations monitor Data Drift in systems such as:
Credit scoring
Fraud detection
Product recommendations
Dynamic pricing
Demand forecasting
Predictive maintenance
Medical risk prediction
Customer-support routing
These systems depend on production data remaining sufficiently aligned with model assumptions.
Future of Data Drift Management
Future developments include:
Real-time feature monitoring
Automated root-cause analysis
Semantic drift detection
Multimodal drift monitoring
Business-aware thresholds
Autonomous pipeline repair
Automated retraining triggers
Cross-model drift dashboards
Integrated data observability
Continuous compliance evidence
Future platforms will increasingly connect Data Drift with model performance, business impact, and automated remediation.
Common Misconceptions
Several myths surround Data Drift.
Common misconceptions include:
Every distribution change damages model performance.
Data Drift and Model Drift are identical.
Retraining is always the correct response.
Only numerical features can drift.
Seasonal changes always indicate a problem.
Data Drift requires ground-truth labels.
Monitoring all features equally is the best strategy.
In reality, organizations should prioritize features and changes based on their influence, business context, and potential impact.
Final Thoughts
Data Drift is a normal part of operating Artificial Intelligence in changing real-world environments. Customers, products, markets, technology, and data pipelines evolve, causing production inputs to move away from the conditions a model originally learned.
Continuous Data Drift monitoring provides an early warning that model assumptions may be becoming outdated. By combining statistical tests, data-quality checks, segmentation, lineage, AI Observability, and business context, organizations can understand whether a change is harmless or requires action.
Organizations that manage Data Drift proactively can maintain more reliable models, improve customer outcomes, reduce operational risks, and protect the long-term value of their AI systems.
Frequently Asked Questions
What is Data Drift?
Data Drift occurs when the statistical distribution, structure, quality, or characteristics of production input data change compared with the data used to train an AI model.
What causes Data Drift?
Common causes include changing customer behavior, seasonality, market conditions, product changes, geographic expansion, pipeline updates, technology changes, and external events.
How is Data Drift detected?
Organizations compare training and production data using statistics, visualizations, distribution tests, drift metrics, embedding analysis, and data-quality checks.
Is Data Drift the same as Model Drift?
No. Data Drift describes changes in model inputs, while Model Drift describes declining model performance. Data Drift can contribute to Model Drift.
Does Data Drift always require model retraining?
No. Teams should first determine the cause and impact. The correct response may involve fixing a pipeline, updating a transformation, changing thresholds, segmenting users, or retraining the model.
Can Data Drift be detected without outcome labels?
Yes. Many Data Drift methods compare input distributions and do not require ground-truth labels.
Comments (0)